Widgets
This page provides an overview of all widgets currently available for the Meta Extender. The Meta Extender is designed to be an interactive tool with an intuitive user interface. Since most widgets are self-explanatory, you can quickly familiarize yourself with each widget using a demo account or the strategy tester. However, a brief explanation of each widget is provided below.
Trendline Trading
The Trendline Trading widget allows you to place trendline trading lines on your chart, which can be used to configure your next trade(s). A trade will automatically open whenever the price crosses a so-called trigger line. With further trendlines, you can configure the stop loss and take profit levels. Since the trendlines can be organized in any direction, these lines allow more flexibility due to the dynamic character over time. Many traders analyze charts based on trends, patterns, and support and resistance levels to predict future price movements, often waiting for a signal for hours or days. This process can be conveniently automated by configuring trendlines that are directly used for opening and closing trades. This type of automated trading is considered semi-automatic since a human defines the boundaries, but the Meta Extender performs trades based on these boundaries.
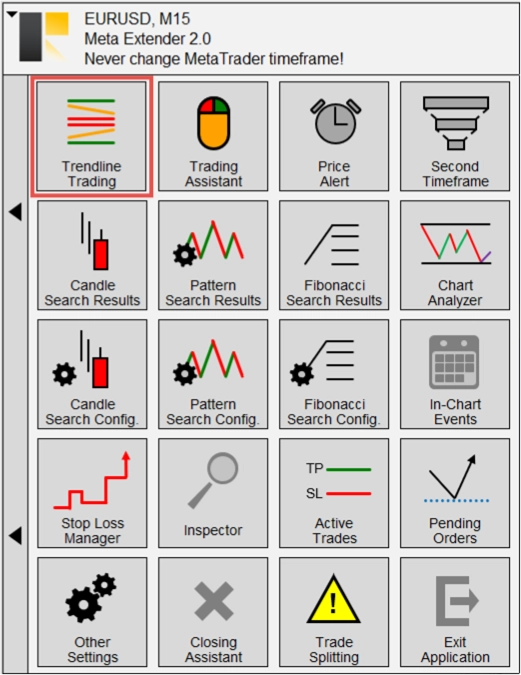
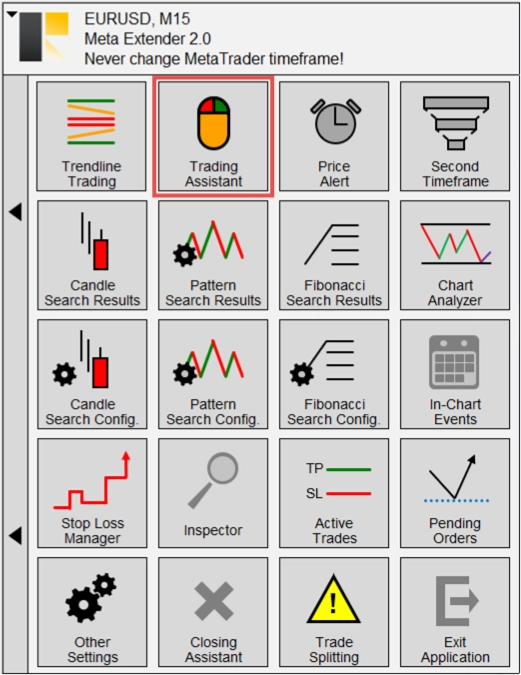
To start using this widget, please open the Trendline Trading widget on the home screen of your Meta Extender.
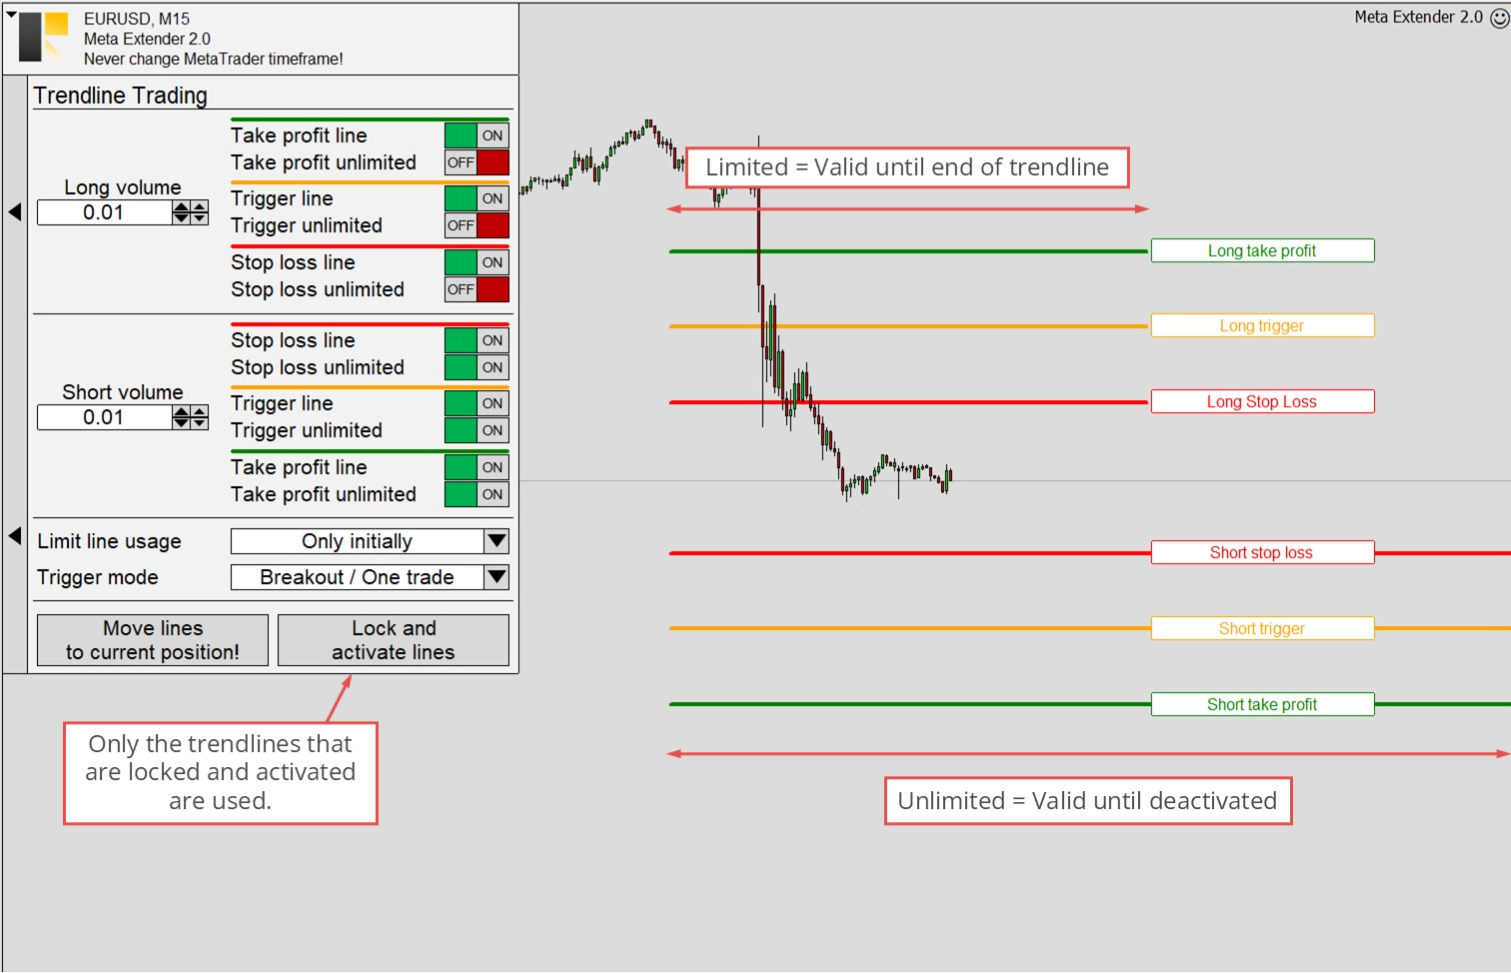
The Trendline Trading widget is divided into two sections: long trading and short trading. Each section has a trigger line, a take profit line, a stop loss line, and a volume size input field. Every trendline can be turned on or off individually, allowing for trades to be opened with or without take profit and stop loss, or in the case of the trigger line, to turn off the feature entirely. However, it's essential to be aware of the risks of not using a stop loss limit line. Always double-check the volume and your risk and money management preferences!
Each trendline comes with the option to use it in either limited or unlimited mode. The image below shows that the trendline remains valid indefinitely when unlimited mode is enabled. In limited mode, it loses its functionality once the time passes beyond the rightmost point of the trendline. After blending in a trendline, you can drag and drop it freely on the chart and adjust the lines according to your identified pattern. To activate the trendlines, they must be locked. This can be done by pressing the Lock and activate lines button. As the name indicates, the lines are only activated once locked. After the lines are locked, they cannot be moved but can be unlocked anytime.
By clicking on Move lines to current position, the trading lines will be placed in the currently visible area of your chart view.
Upon activation, the logic automatically initiates a trade when the trigger line is crossed, using the volume configured in the panel. Depending on the limit line usage, the widget configures the stop loss and take profit when the trade is opened or uses the lines for dynamically configured take profit and stop loss levels. Two options for how the limit lines can be utilized are illustrated below.
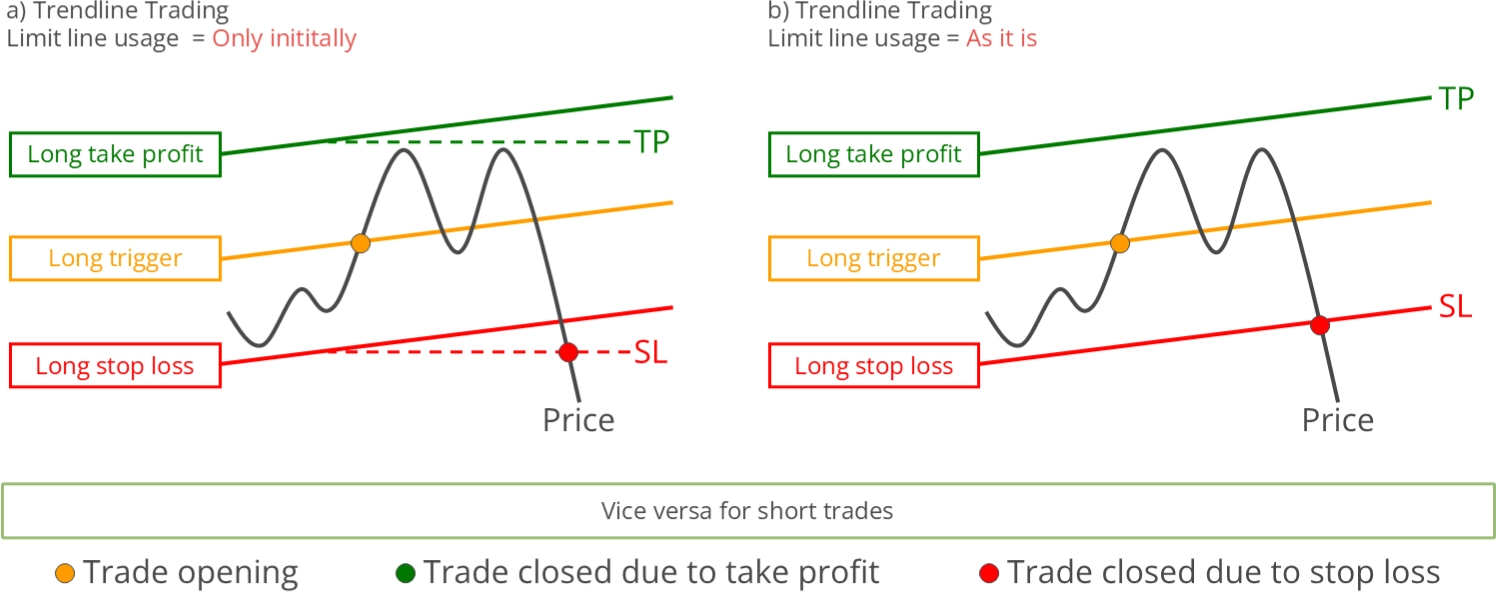
Limit line usage = Only initially
When Only is initially selected as the limit mode, the limit line values at the moment of trade opening are used as the stop loss and take profit values. In this mode, the take profit and stop loss line values are only used once. After a trade is initiated, the trendlines can be unlocked and reused immediately. Thus, the initially configured risk ratio remains static.
Limit line usage = As it is
In contrast, the As it is mode instructs the widget to use the stop loss and take profit trendlines in the same way as the trigger line. The trade is closed whenever the price crosses either the stop loss line or take profit line. This implies a dynamic risk ratio because the stop loss and take profit values are not fixated. With this limit usage method, the dynamic adaptation of the stop loss represents a form of linear stop loss trailing. Unlocking the trendlines while a trade is active will turn off the stop loss functionality. In this case, the widget will issue a warning and inform you to set a stop loss manually.
Next, we'll discuss the so-called Triggered mode. This setting determines how the trigger lines are used. Two options are available: Breakout and Channel mode, both of which are illustrated below.
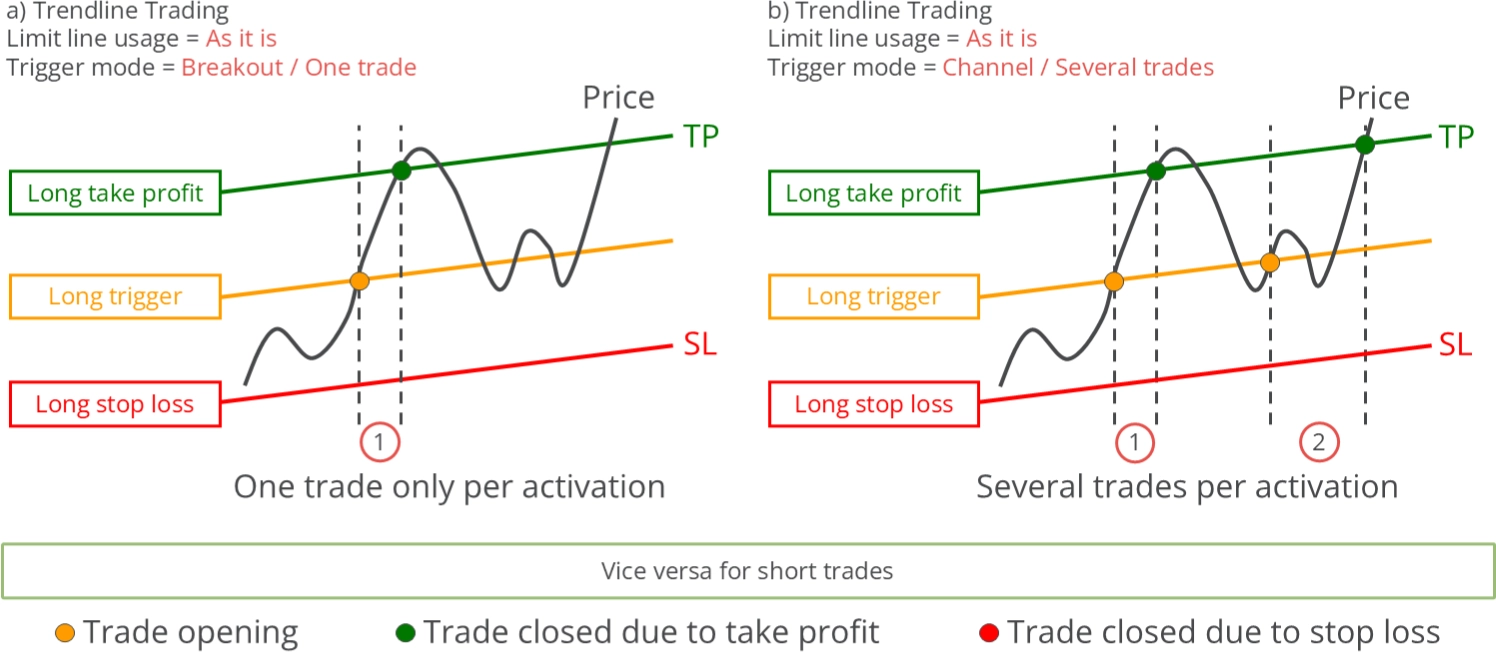
Trigger mode = Breakout / One trade
In Breakout mode, each trigger line can initiate only one trade, regardless of how often the price crosses the trigger line. This mode helps react to expected price movements, such as those that occur after economic news releases. In Breakout mode, a long trade is initiated when the price crosses the long trigger line from below to above, and a short trade is initiated when the price crosses the trigger line from above to below. If the price when locking the trigger line is higher (long direction), no action will be taken until the price drops below the trigger line and then increases again. Conversely, the process is reversed for short positions: if the price when setting the trigger line is lower, no action will be taken until the price rises above the trigger line and decreases again.
Trigger mode = Channel / Several trades
In Channel mode, the trigger line initiates a trade each time the price crosses it from below to above for long trades and from above to below for short trades. The Channel mode is especially beneficial for trading within support and resistance levels or trend channels that exhibit repeated minor downward and upward movements. Unlike the Breakout mode, which allows for only one open trade at a time, the Channel mode permits multiple trades to be open simultaneously.
In both modes, the trendlines can only be locked and activated when the current price is between each trendline's left and right points. This condition must be met for all trendlines that are used. The stop loss trailing system configured in the Trading Assistant widget and Stop Loss Manager will also apply to trades initiated with the Trendline Trading widget.
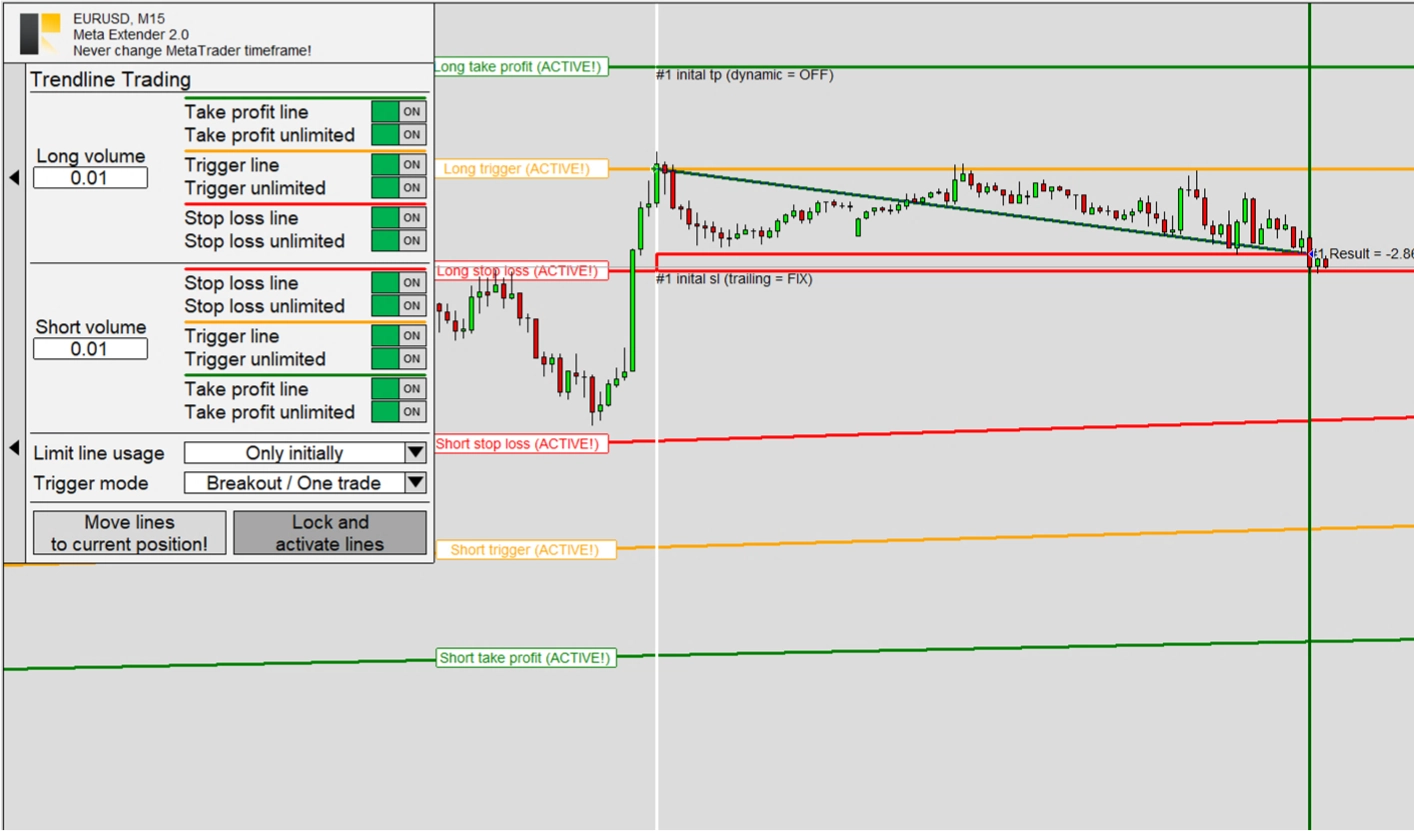
The above chart illustrates the process of initiating a long trade using the Trendline Trading widget. As depicted, the long trade is triggered when the price ascends and intersects the trigger line. The initial stop loss for this trade was set using the value from the stop loss trendline. Shortly after the trade opened, a fixed distance trailing stop was used, but it remained static due to the continuously falling price. The trade was eventually stopped out after a brief period.
Trading Assistant
The following widget we'll discuss is the Trading Assistant. This tool is designed to simplify order placement by using chart lines to configure all order parameters, making risk and money management straightforward and visual. It also offers the option to enable sophisticated stop loss trailing management. You can view the widget by clicking Trading Assistant on your Meta Extender home screen.
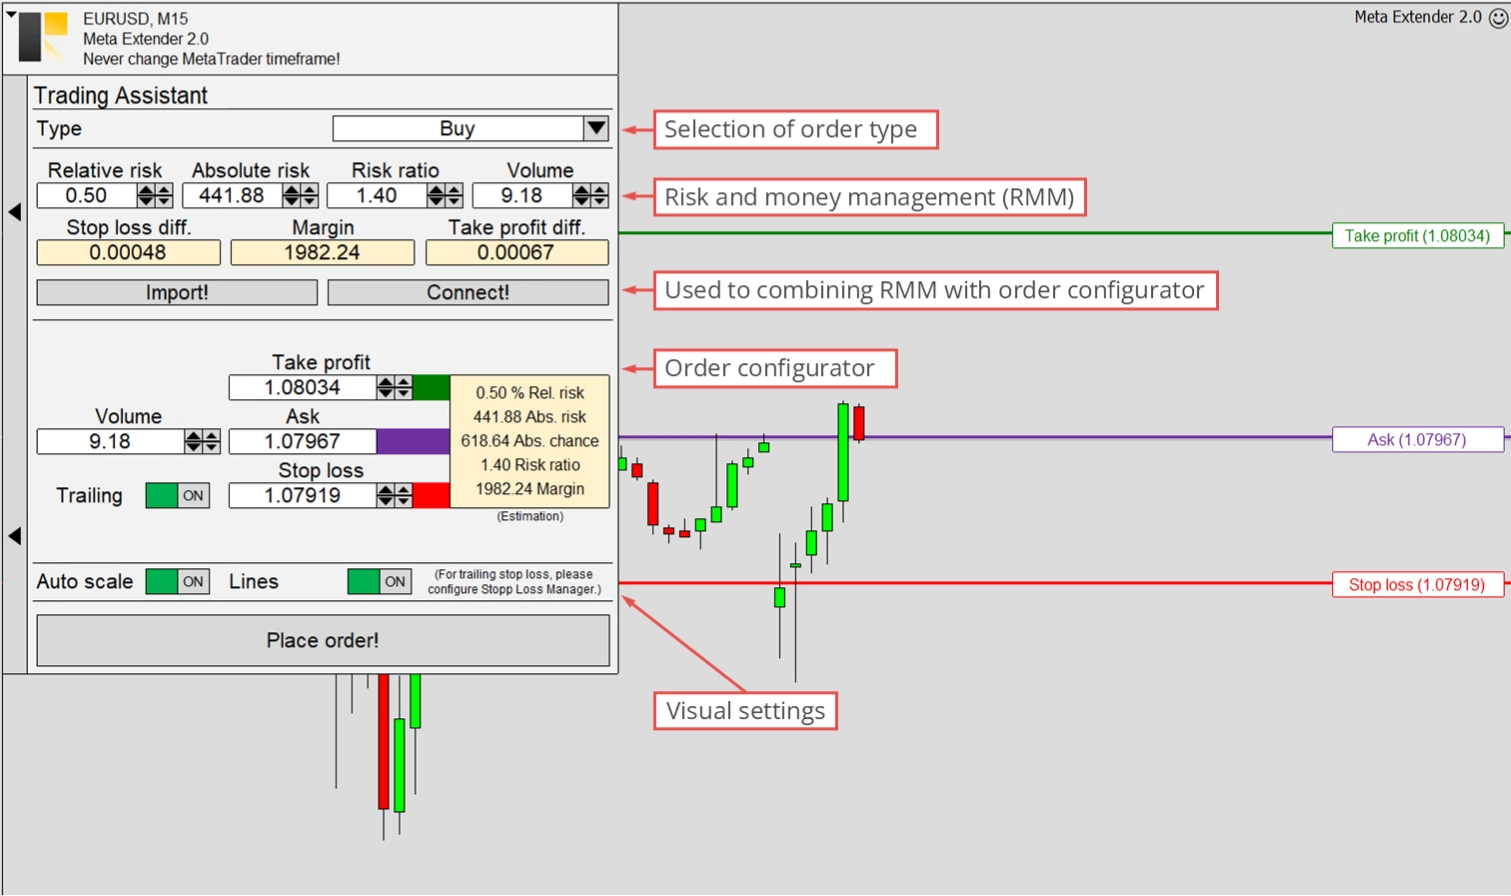
The Trading Assistant view comprises two main features: the Risk and Money Management input parameters and the Order Configurator. The former allows you to input the absolute or relative risk and the planned position volume. The tool then provides the stop loss difference, take profit, and required margin. These values are updated in real-time as you modify the input parameters. Please note that this calculation does not include commission and swap, often influencing the risk or potential chance.
The Order Configurator ensures that only valid orders can be transmitted to your broker's server. For instance, limit and stop orders can be used with a pending price, while market orders cannot. Depending on the order type (the topmost input on the widget), it verifies the correctness of all input parameters. Another key feature is the Trailing switch, which enables stop loss trailing, a powerful strategy to secure profits and limit risk when the trade moves in your favor. The actual stop loss configuration can be done with the Stop Loss Manager widget, but the final decision to turn it on or off is made in the Trading Assistant. Once trailing is enabled, this setting is applied globally for all other features, notably the Trendline Trading widget.
At the bottom of the widget screen, you'll find switches to change MetaTrader's auto-scaling setting and enable the chart configuration lines. Each input parameter (Take Profit, Pending Price, Stop Loss, and Expiration) can be configured directly in the chart view or with the input fields. By using this handy tool, you can automatically practice trading based on proper risk and money management, with the most crucial calculations automated in the background.
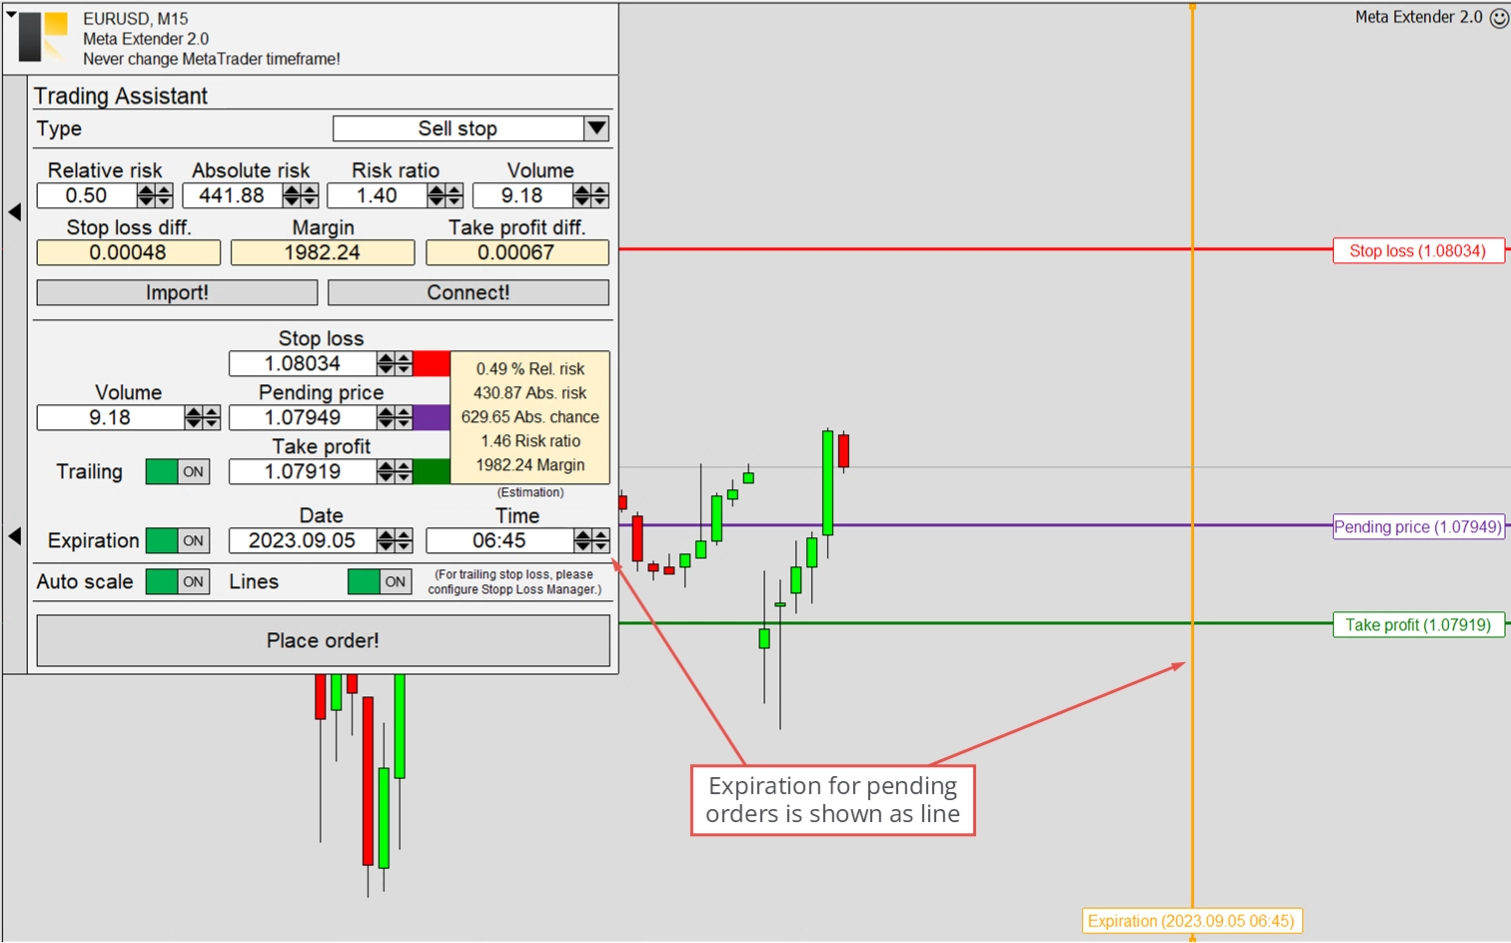
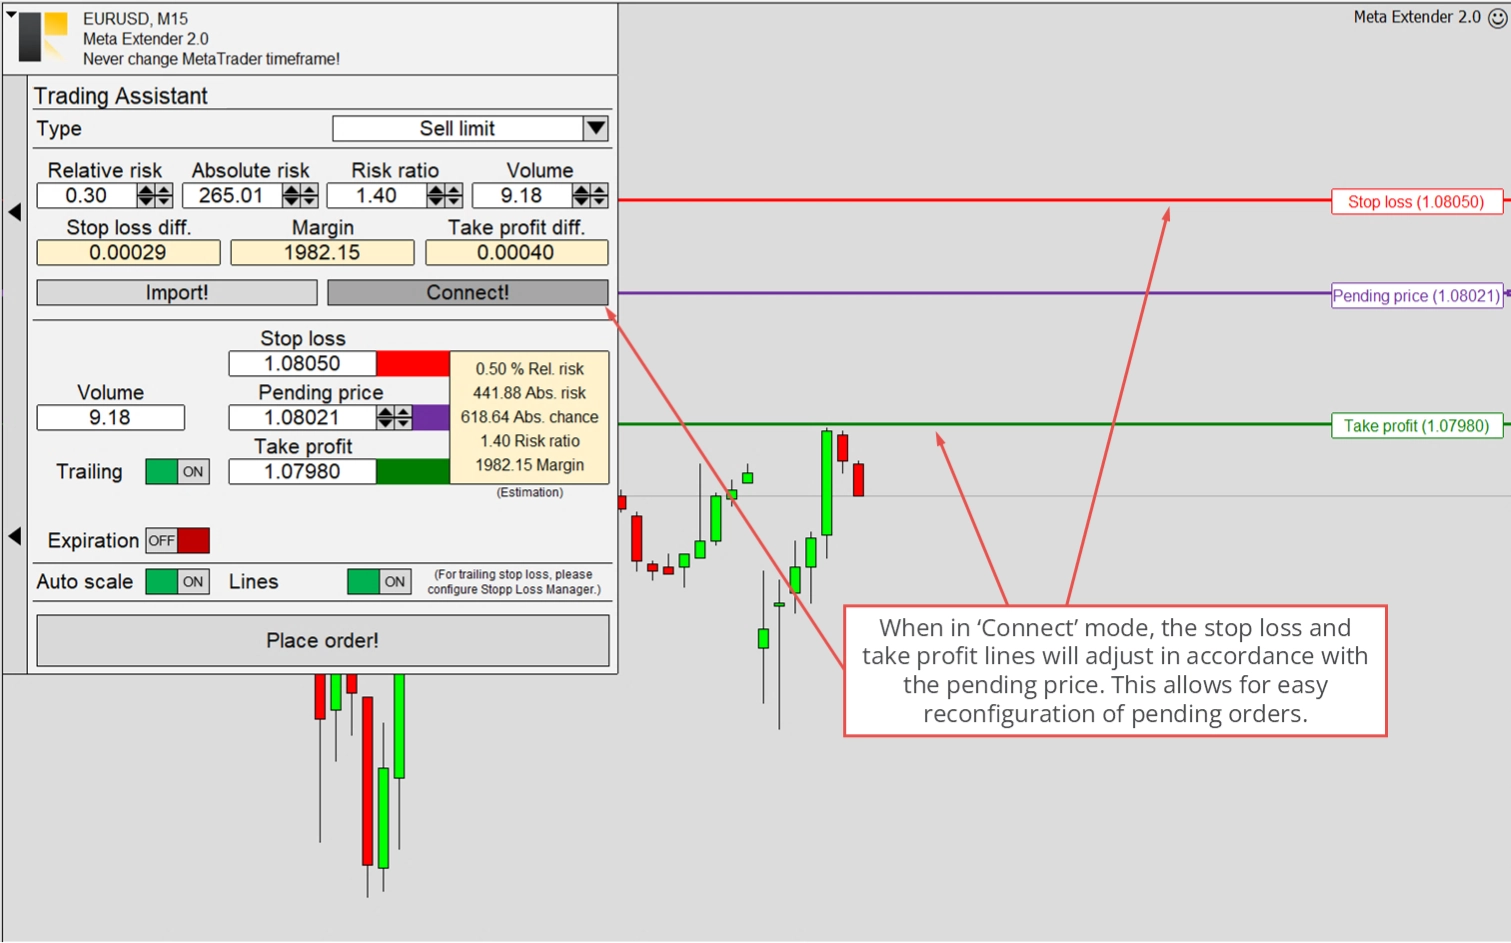
The illustration below demonstrates how the chart view appears when a limit order is selected for configuration. The stop loss and take profit lines are color-coded depending on the trade direction to ensure clear visibility.
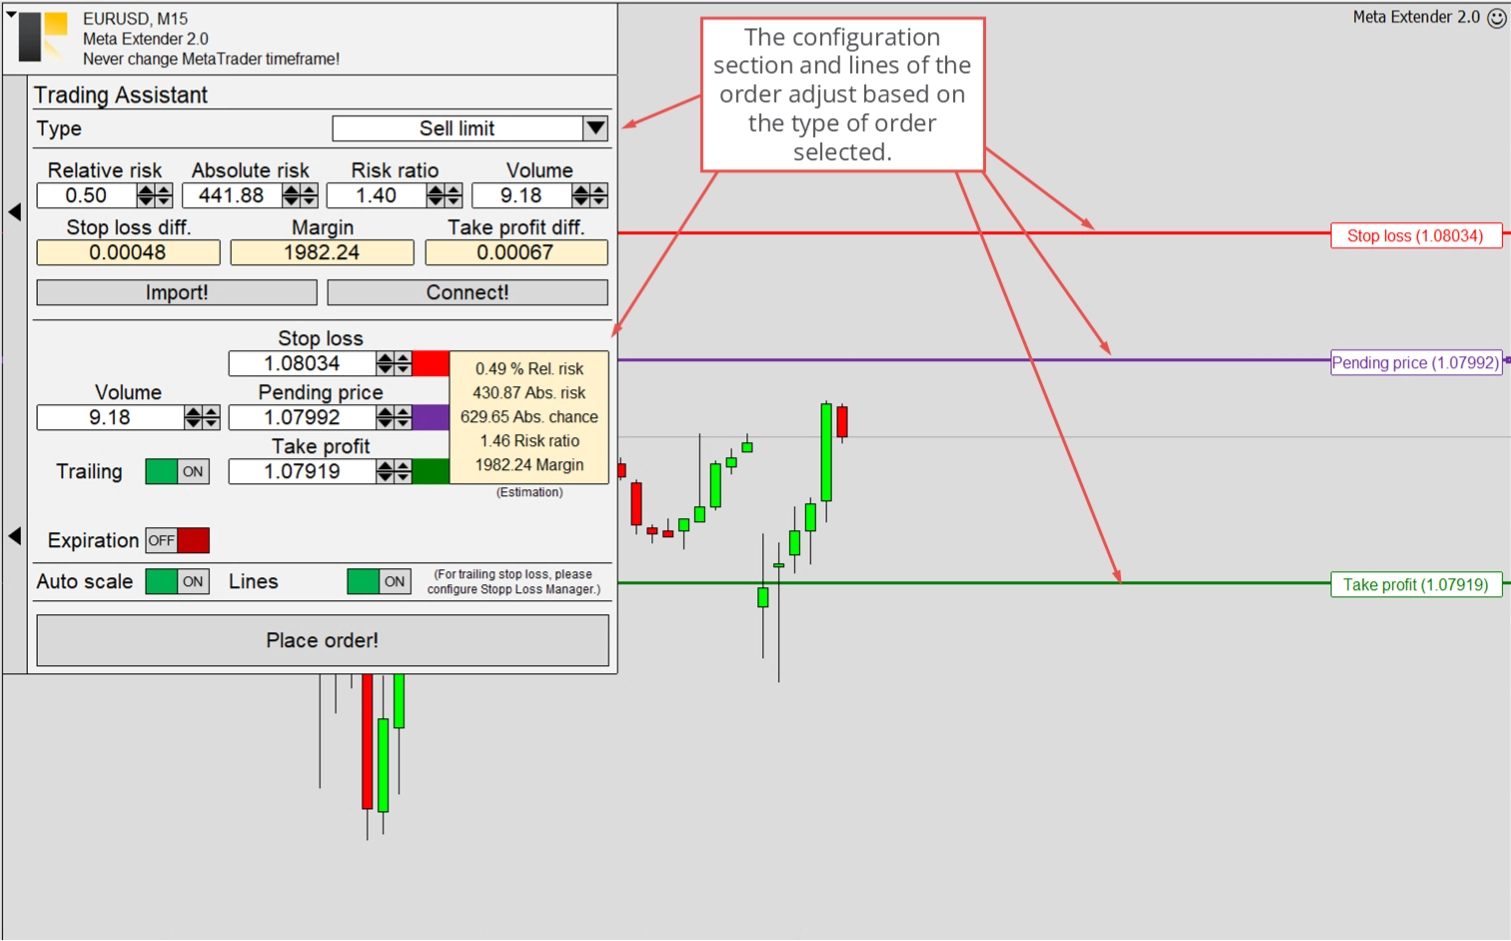
It's possible to set an expiration date for limit and stop orders. The pending order will be deleted if the pending price isn't triggered by the expiration date. The expiration date can be configured with a horizontal line or the Date and Time input parameters.
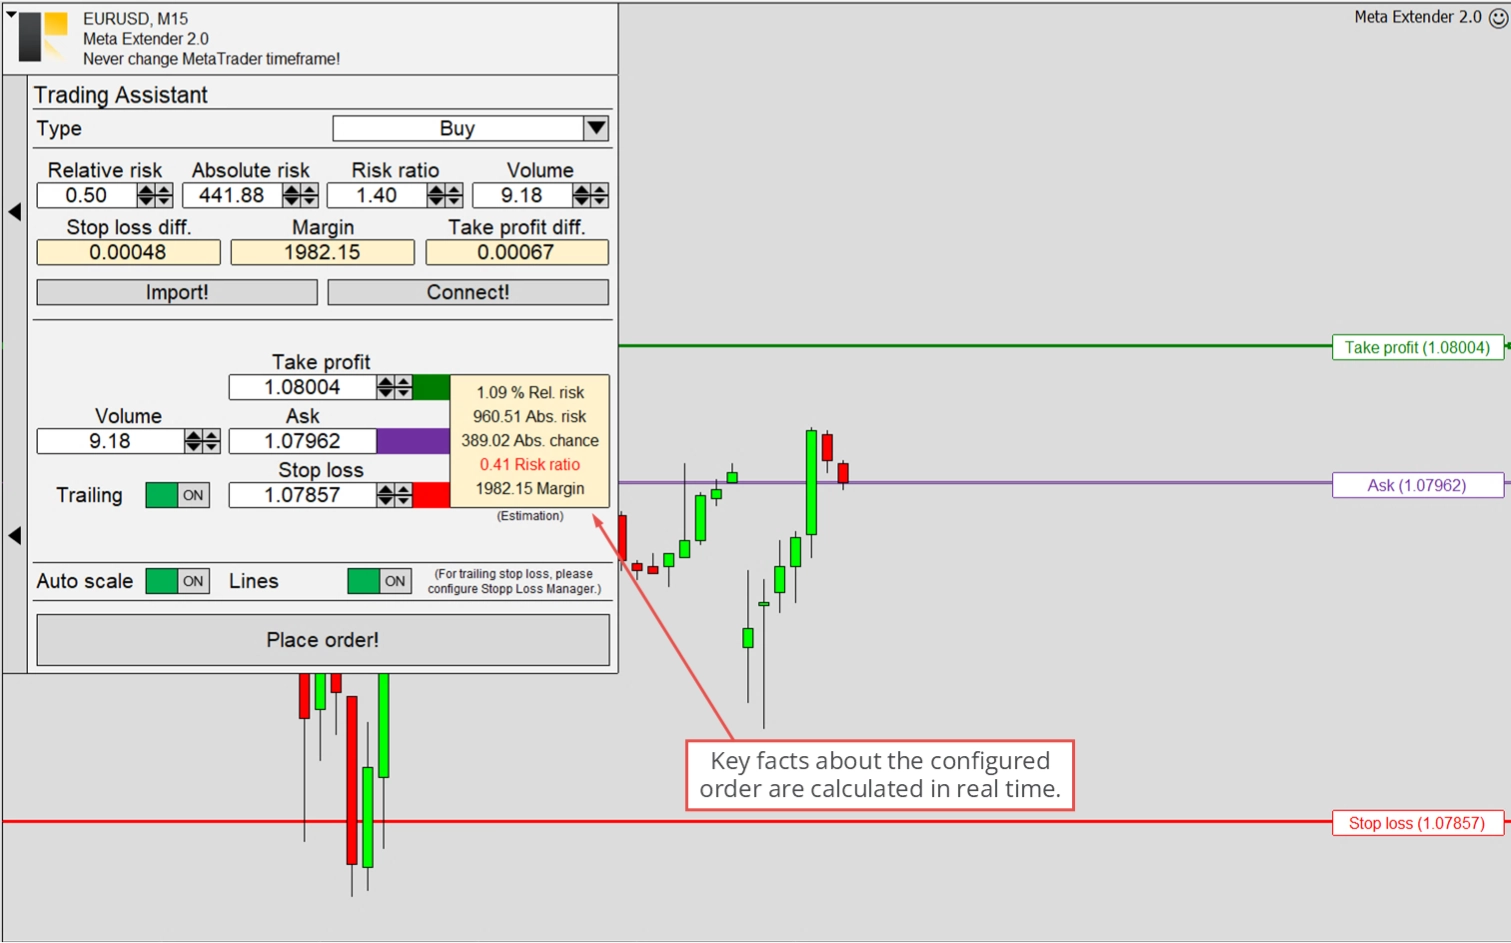
When the input parameters are changed, the yellow outlet box updates the trade key facts like relative risk, absolute risk, and other important information. If specific parameters require your attention, this will also be displayed in this outlet box. For example, when the risk ratio is too low or no stop loss is configured. These input constellations are considered poor risk and money management measures, and the widget will notify you of this.
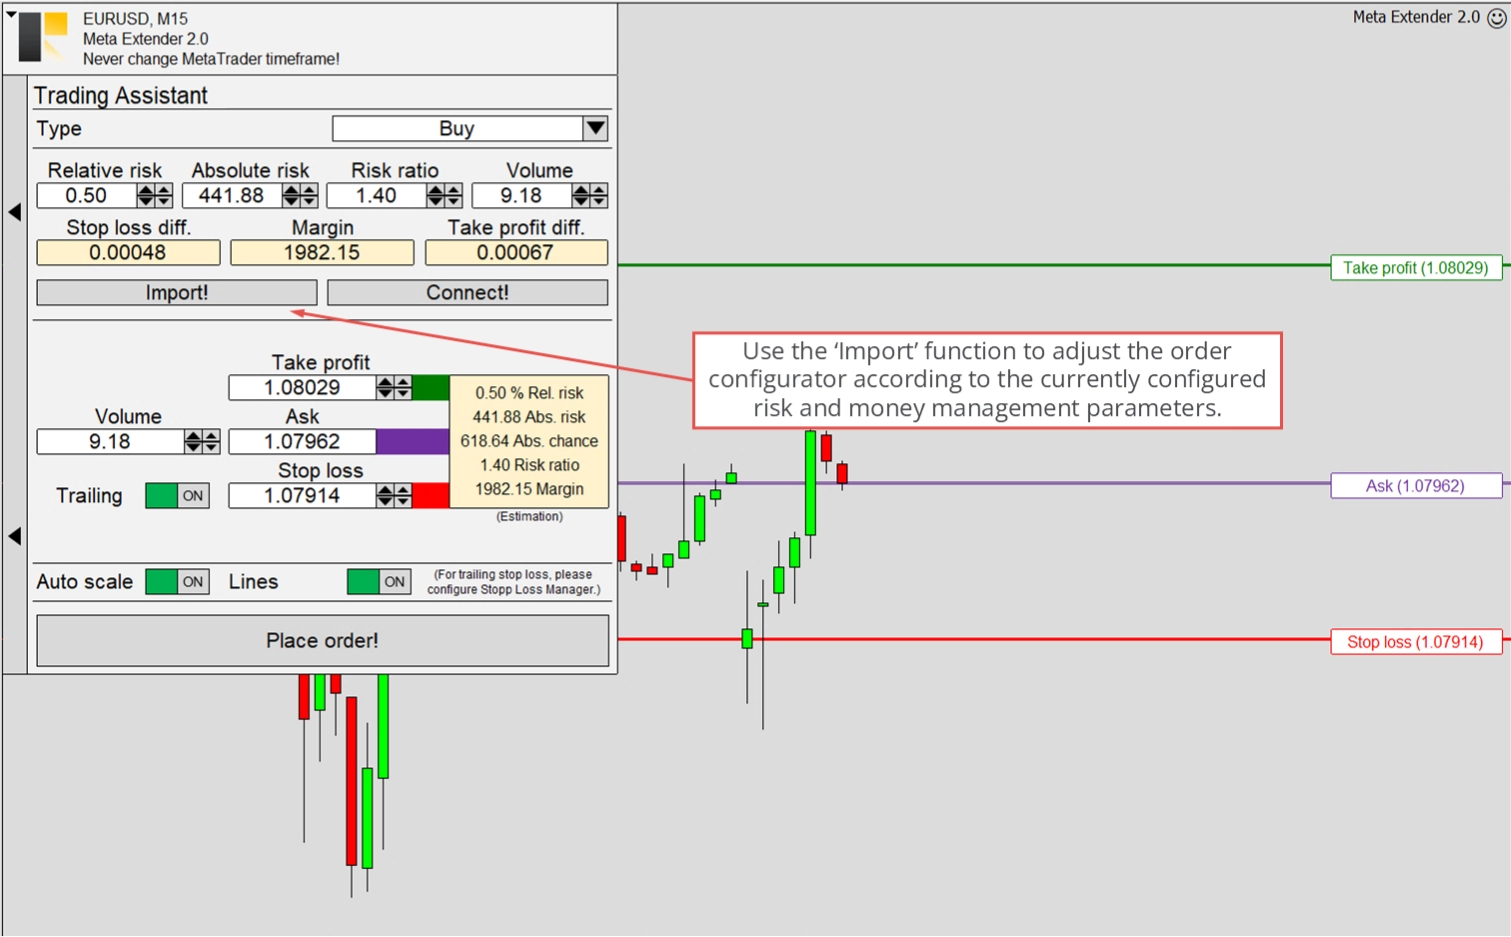
The widget integrates risk and money management, which can interact with the order configurator. You can import the currently configured risk and money management settings by pressing the import button. This action adjusts all input parameters of the order configuration to match your risk preferences. While this is a one-time process, you can still adjust using the input field or trading lines.
Linking both modules is another way to integrate risk and money management with the order configurator. If this option is used, the stop loss, take profit, and volume can no longer be configured with the order configurator. Instead, every trade is exclusively configured by the risk and money management input parameters. This manual trading method is highly recommended for beginners, and even professionals will appreciate the simplicity of configuring orders in this manner.
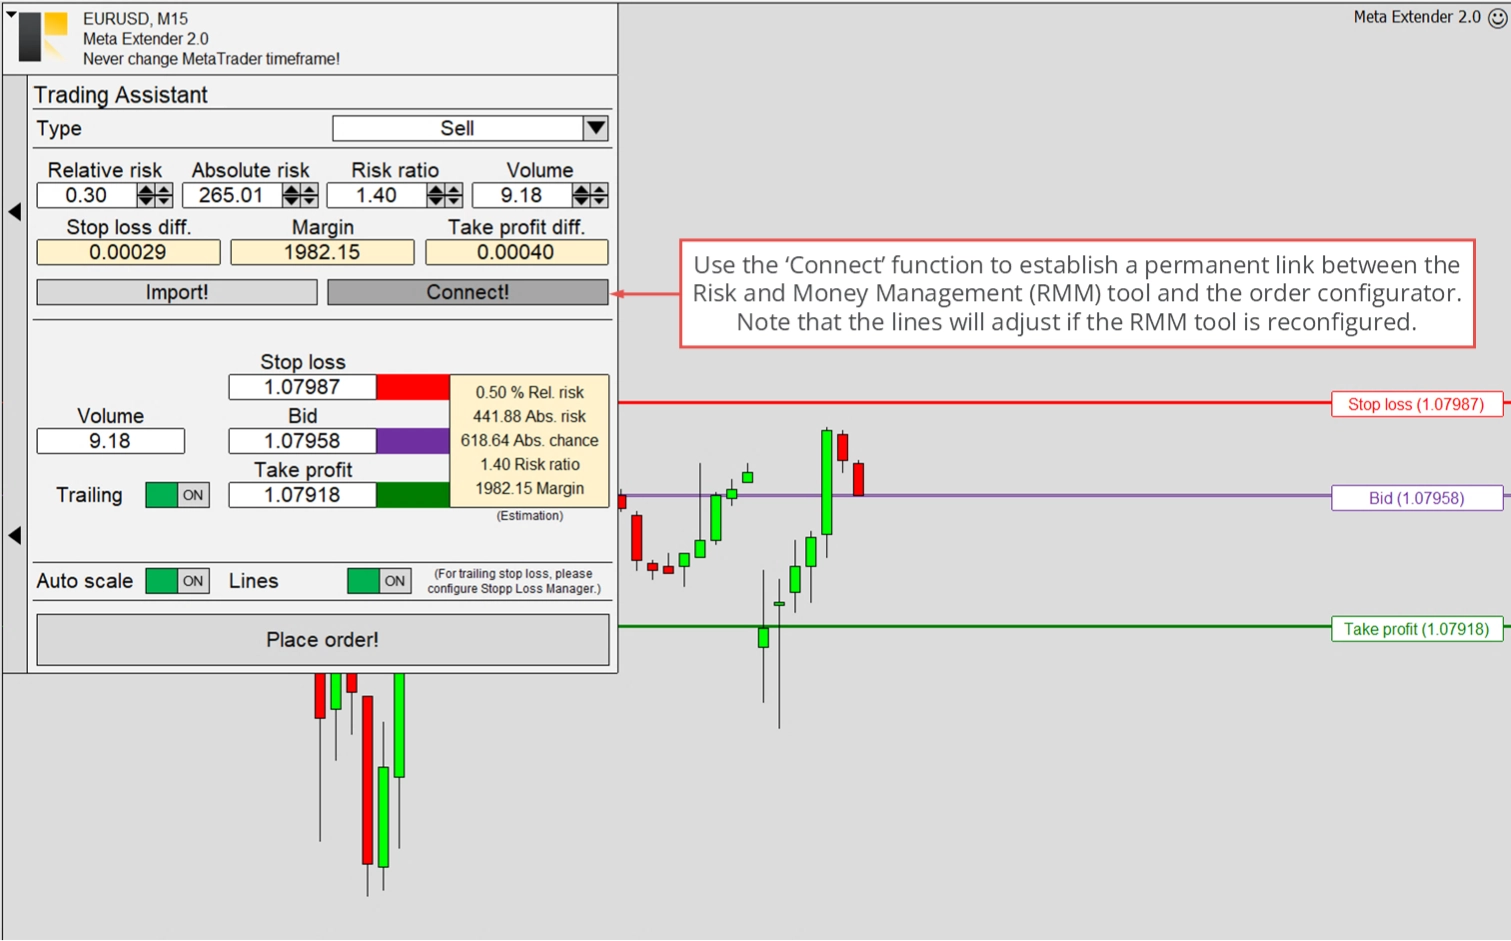
When the connect mode is enabled, the stop loss and take profit lines adjust accordingly when the pending price line is reconfigured. This ensures proper risk and money management settings, even for limit and stop orders. This feature is illustrated in the image below.
After configuring the order, you can place a trade by pressing Place order! Please note that the Meta Extender is designed as a one-click application, meaning there won't be any approval dialog to confirm your decision to place an order.
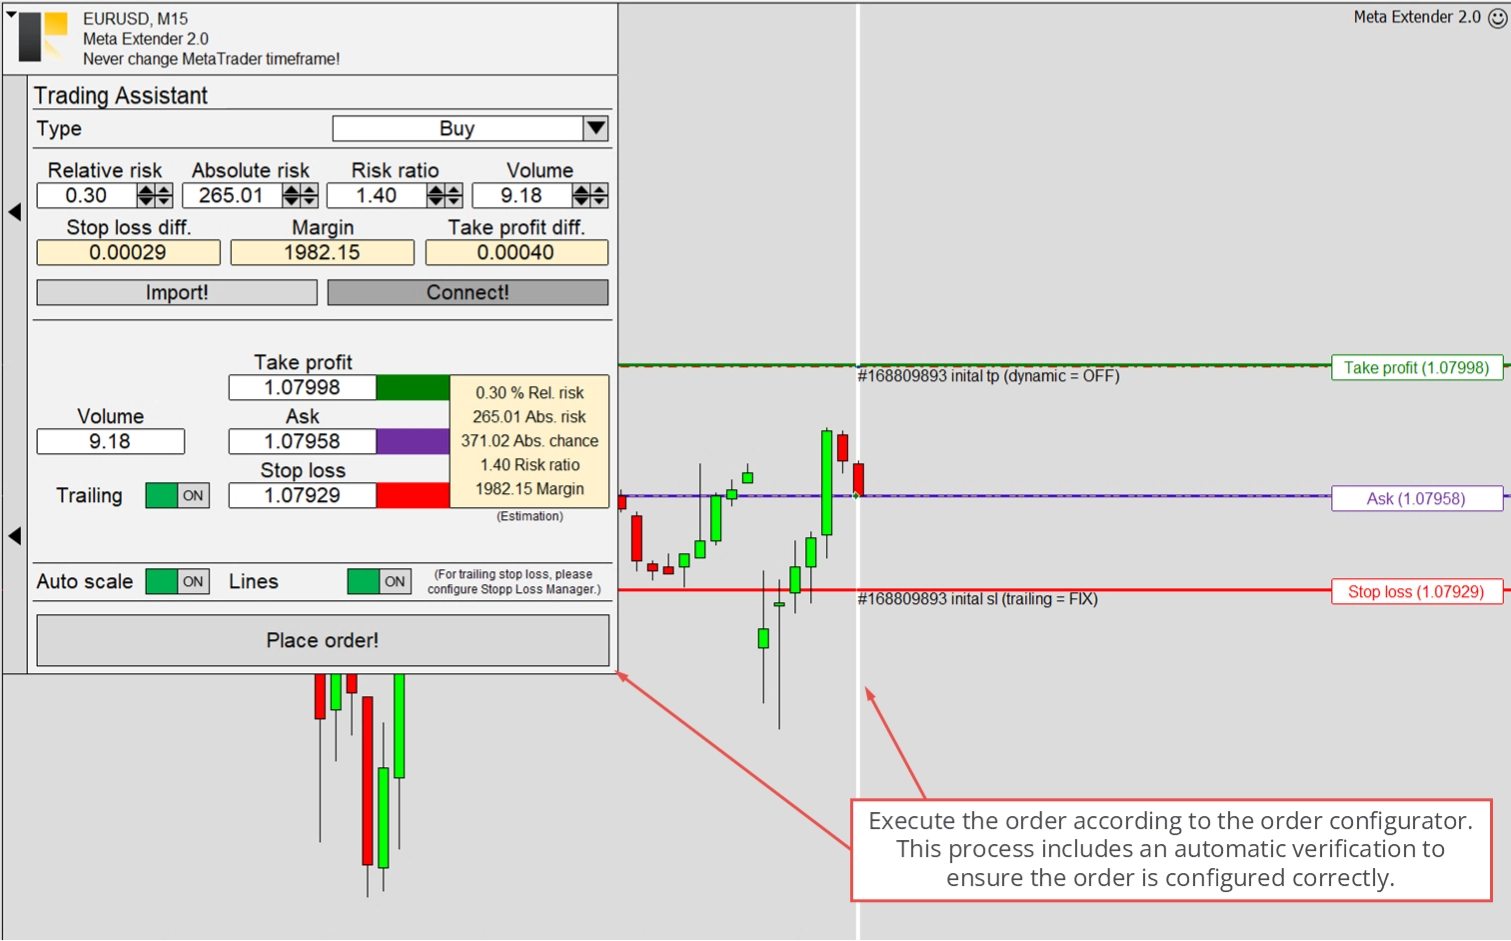
Orders can only be placed when the market is open; consequently, trading is permitted. The widget will display an error if an order cannot be placed. This typically occurs if the market is closed or you attempt to place an order with stop loss trailing but without an initial stop loss.
Price Alert
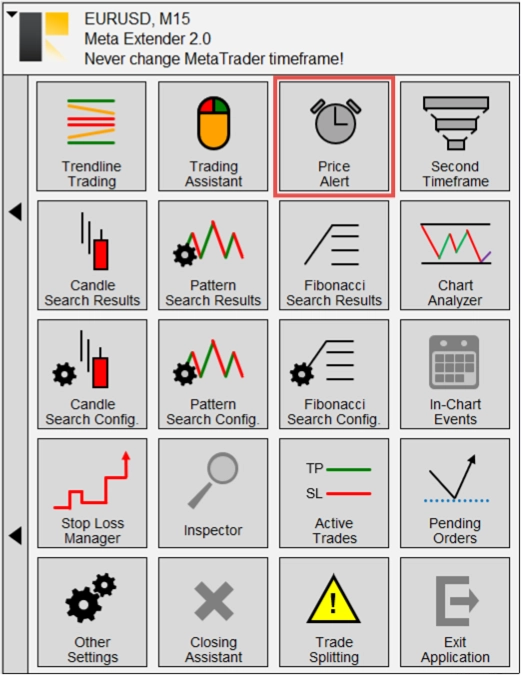
The Price Alert widget is a convenient feature that enables you to receive alerts through email or on your mobile device when a specific price level is achieved. This tool is especially beneficial for tracking price levels such as support and resistance. To access it, choose Price Alert from the Meta Extender home screen.
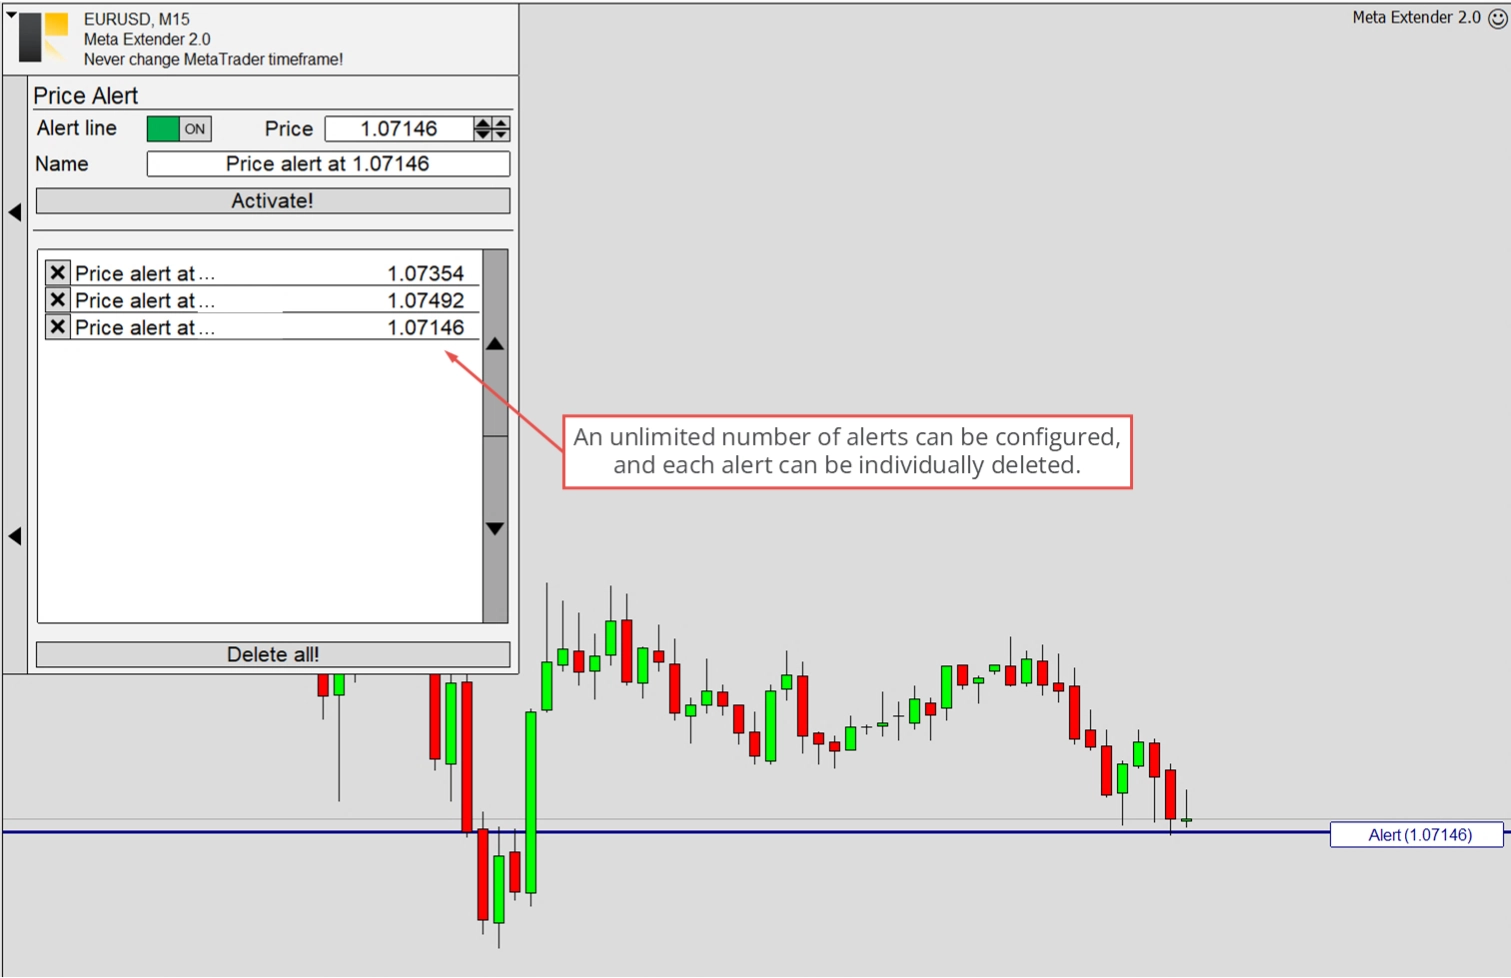
The widget is straightforward to set up and use. The only parameters you need to set are the price at which the alert should be activated. You can configure it by moving a line directly on the chart or using an input field. Each alert can also be renamed to save some notes.
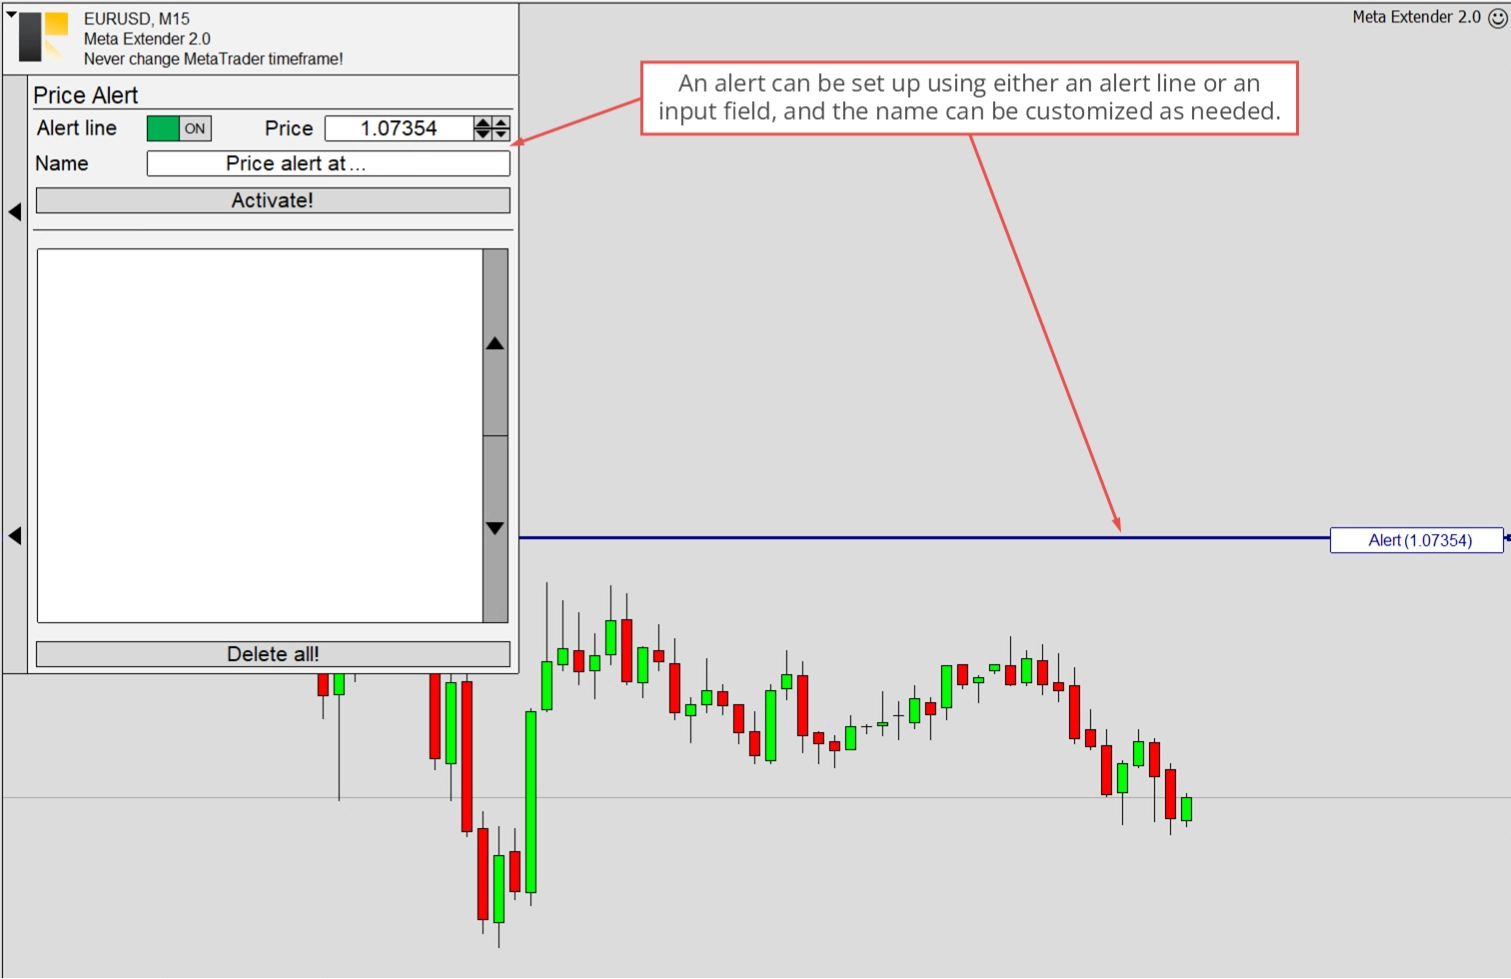
By clicking Activate, you can save and enable an alert. Each alert's name and trigger value will be displayed in the table area. You can create and activate an unlimited number of alerts.
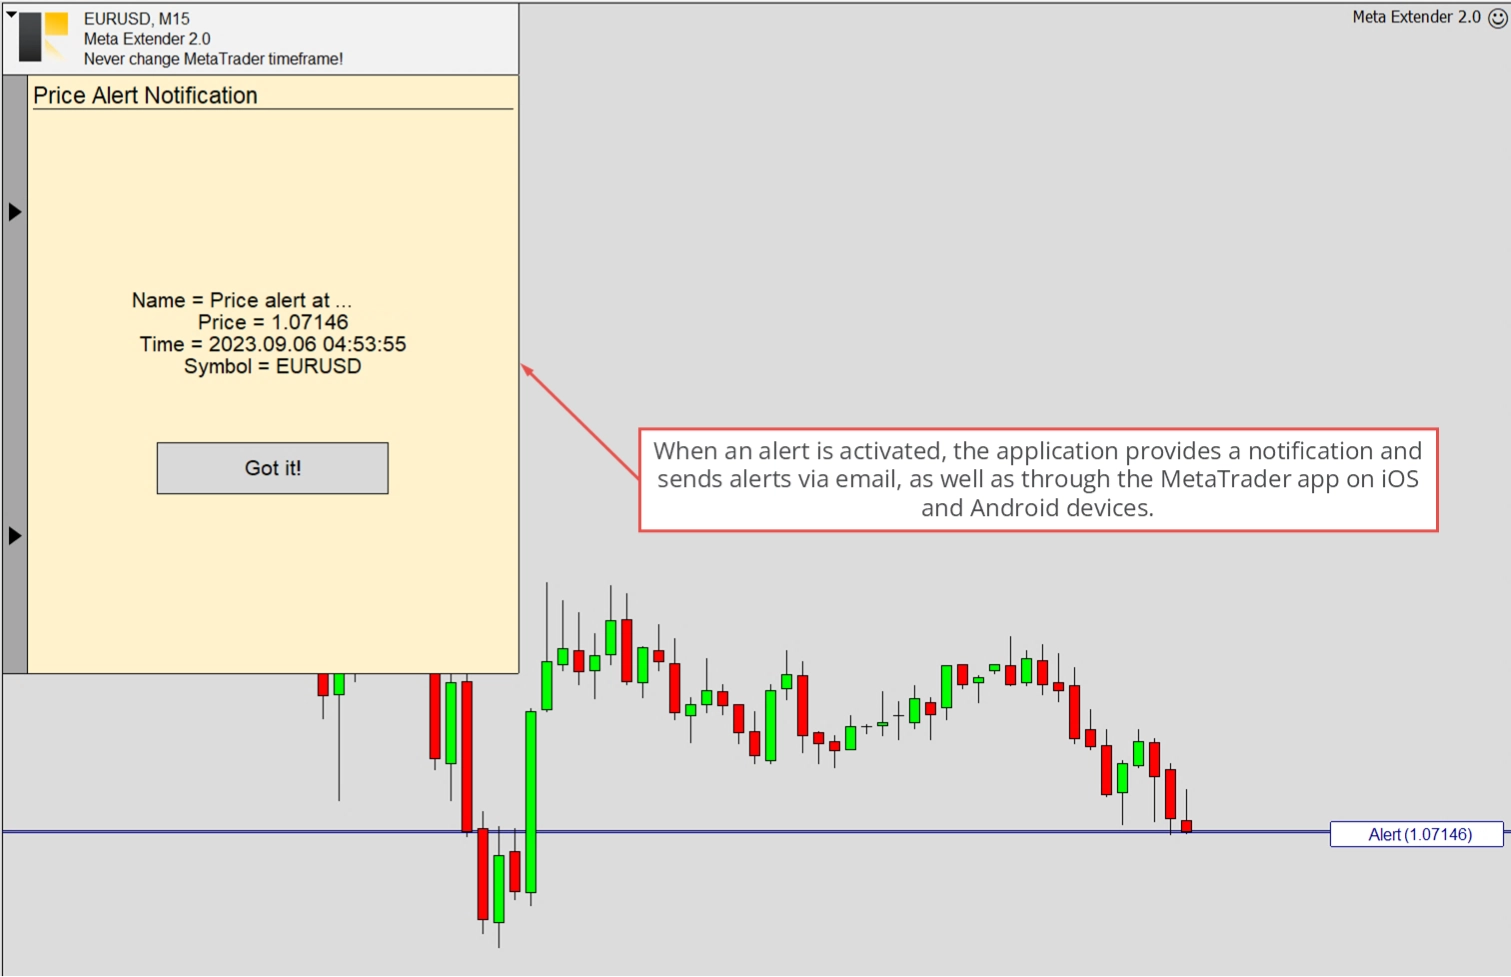
When an alert's price is reached, Meta Extender will notify you directly in the user interface panel. This notification includes the alert's name, price, time, and symbol. The same information can be sent as an email or a mobile notification.
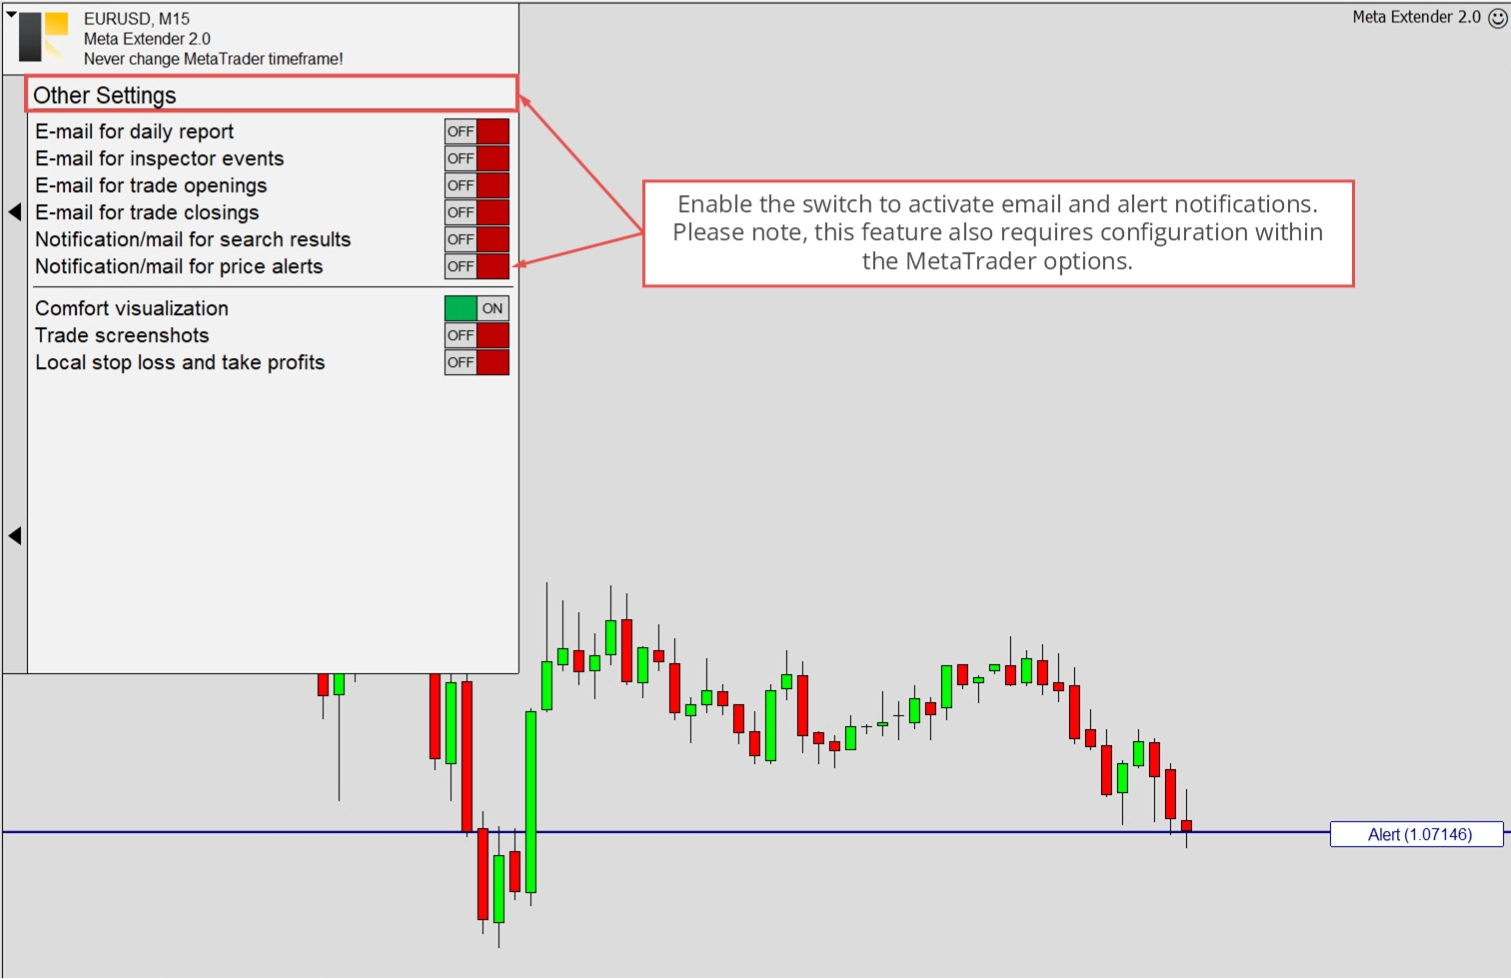
Please note that to receive email and mobile notifications, you must enable the Notification/mail for price alerts in the Other settings widget. Additionally, MetaTrader must be configured correctly. You can find instructions on how to do this here.
Second Timeframe
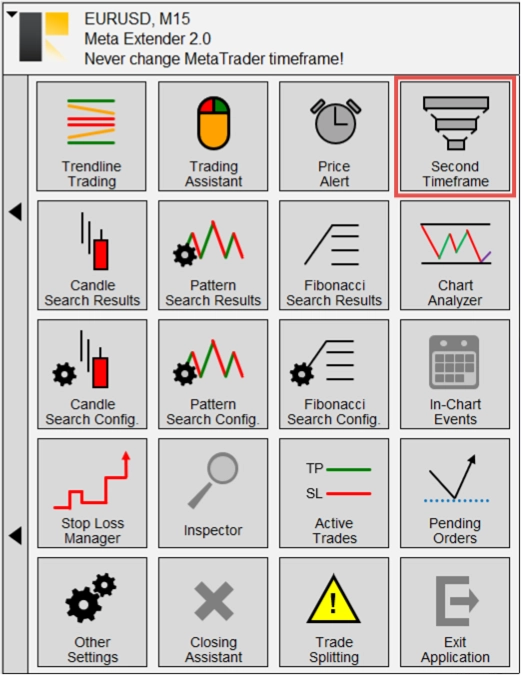
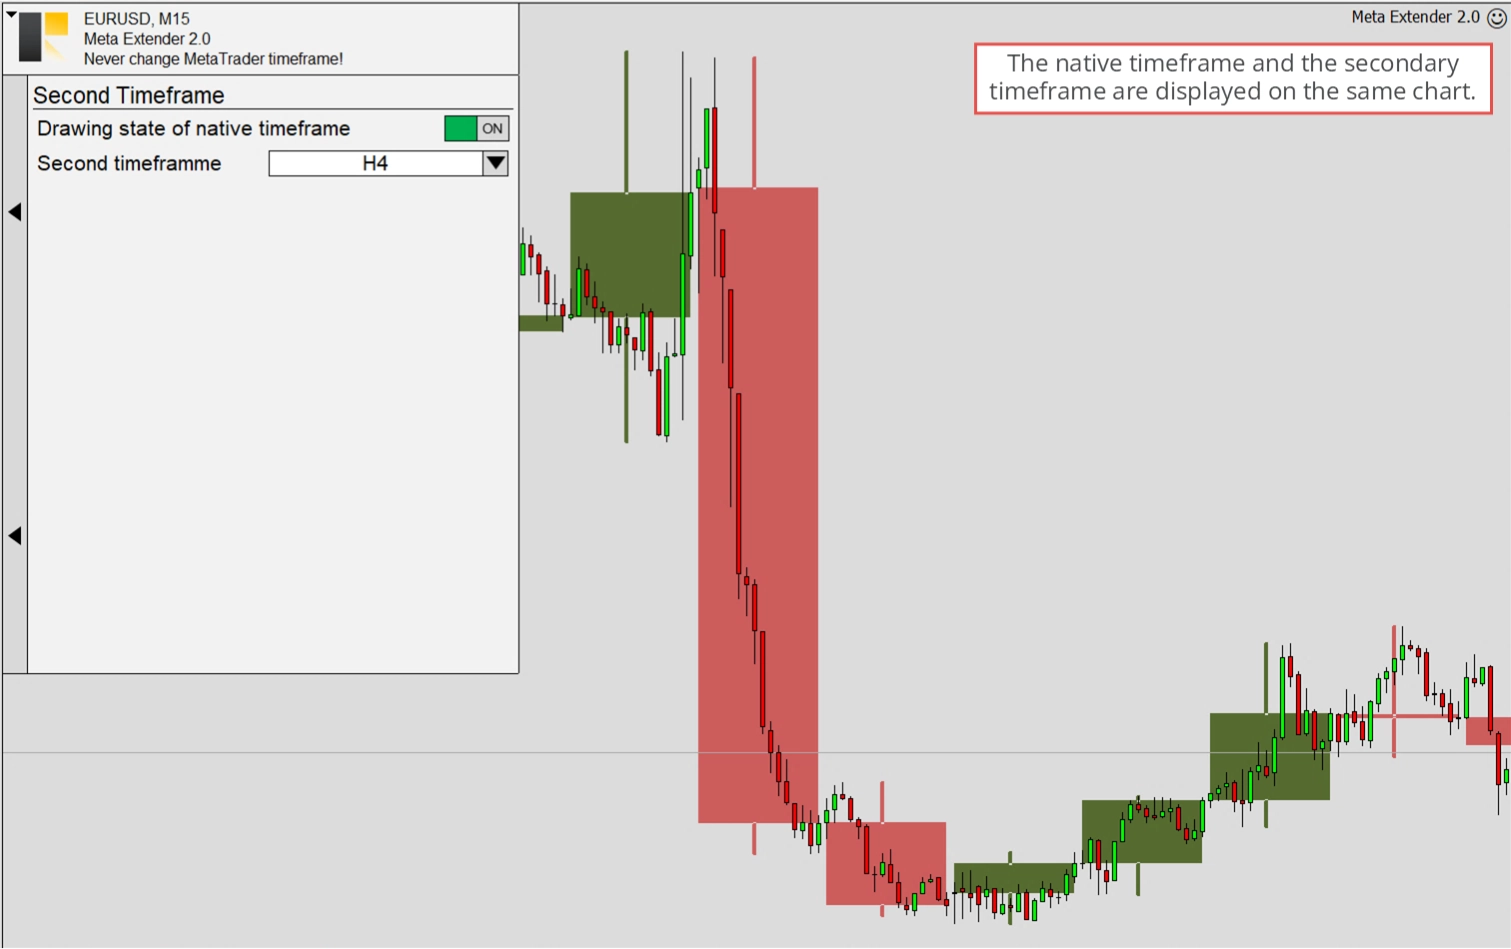
Considering chart movements in a higher timeframe is a crucial practice in trading. This approach is essential to avoid initiating trades that contradict the general trend. Meta Extender provides a feature that allows you to incorporate a higher timeframe into the same chart, offering a comprehensive understanding of the price in relation to your trading timeframe. Please use this feature by opening the Second Timeframe widget from the Meta Extender home screen.
You have two options within this widget: turning off the native timeframe and enabling a higher timeframe. The image below illustrates a EURUSD chart opened in the M15 timeframe with H4 data overlaid as the second timeframe.
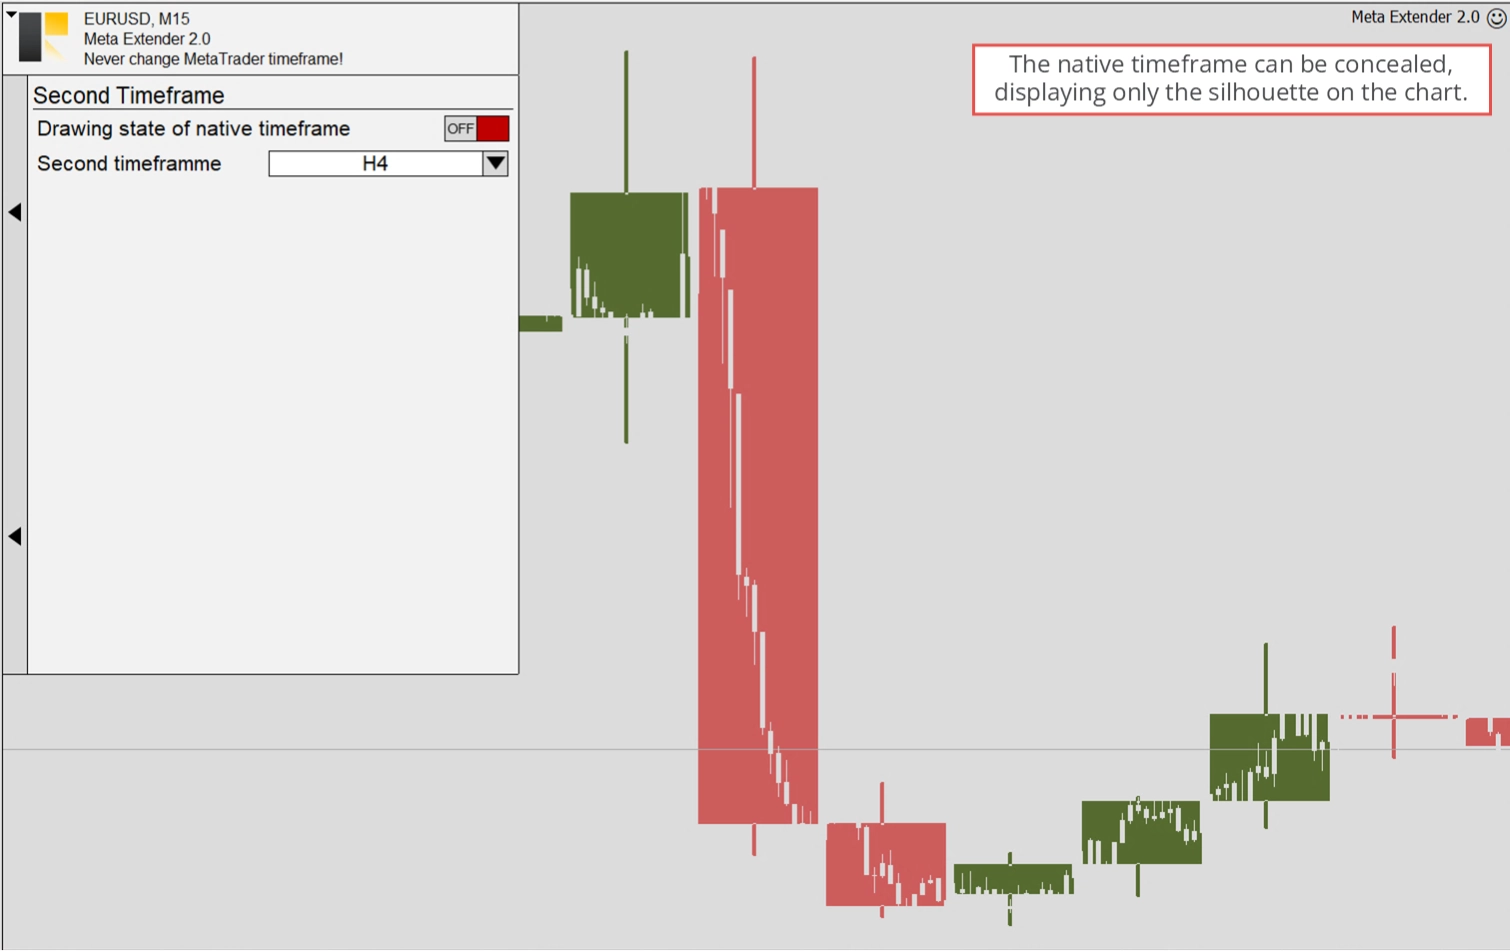
By turning off the native timeframe, you can concentrate solely on the overlaid timeframe. In this setup, the native timeframe is only indirectly visible, as shown below.
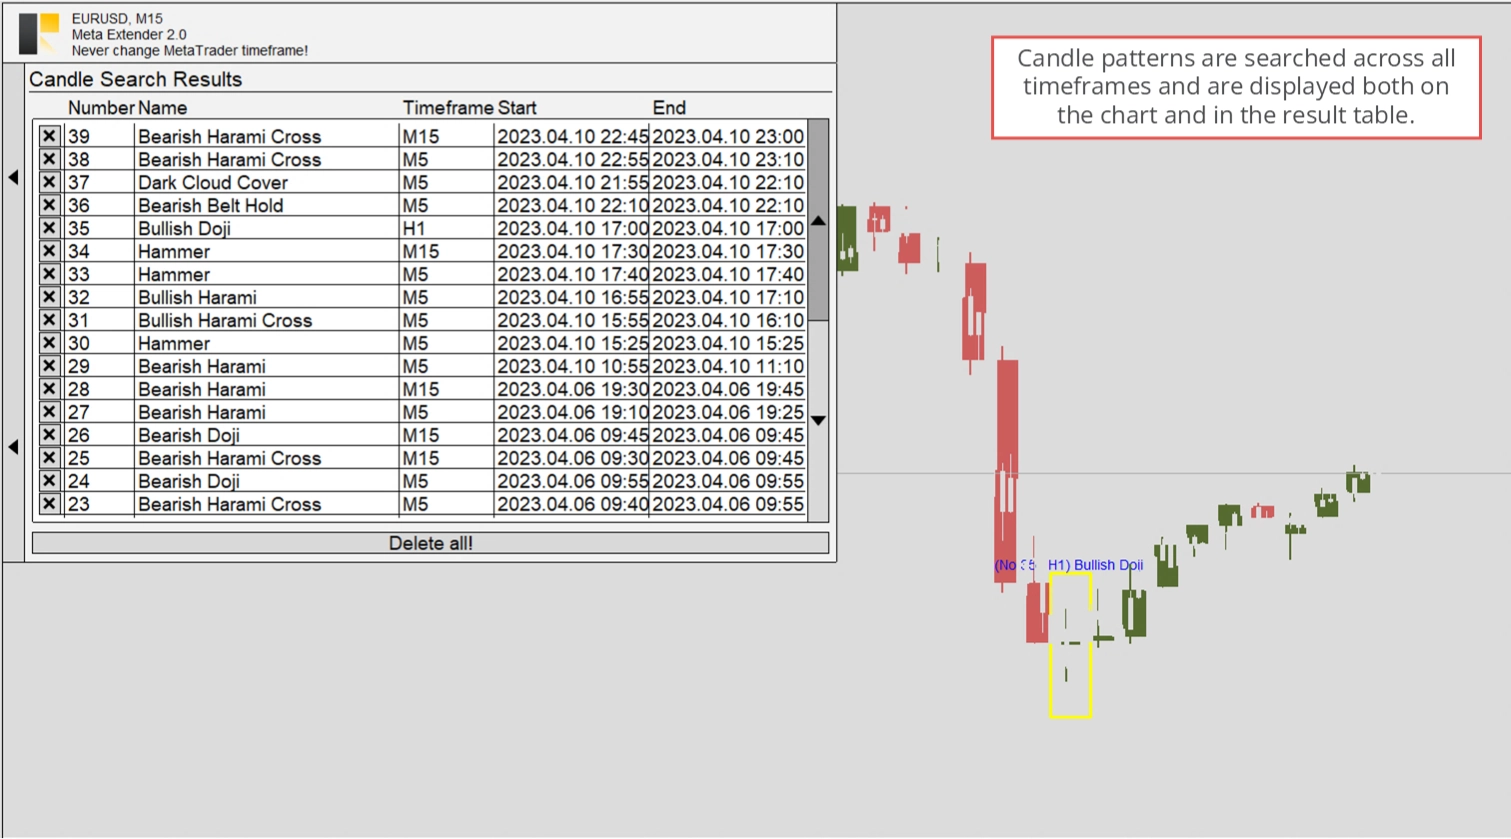
Candle Search Results
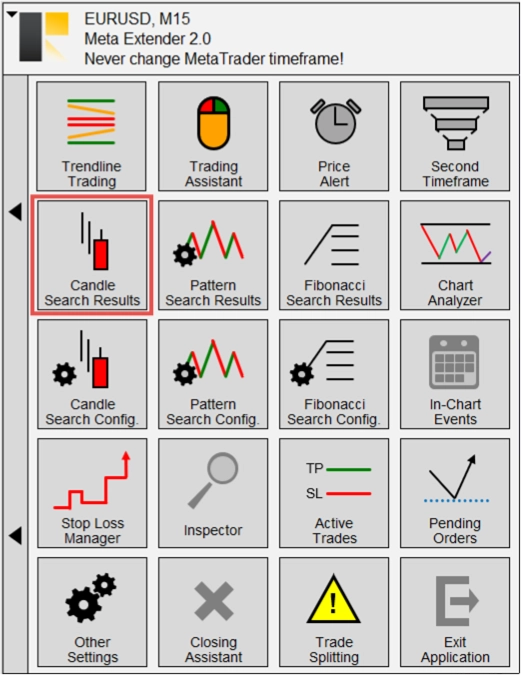
The Meta Extender has a search engine that identifies commonly known candle patterns on the chart. These patterns are searched across all timeframes simultaneously. Each identified pattern is conveniently listed in a table. To access this widget, please press the Candle Search Results button on your home screen.
You can view all the search results and have the option to delete them individually or clear the entire search history.
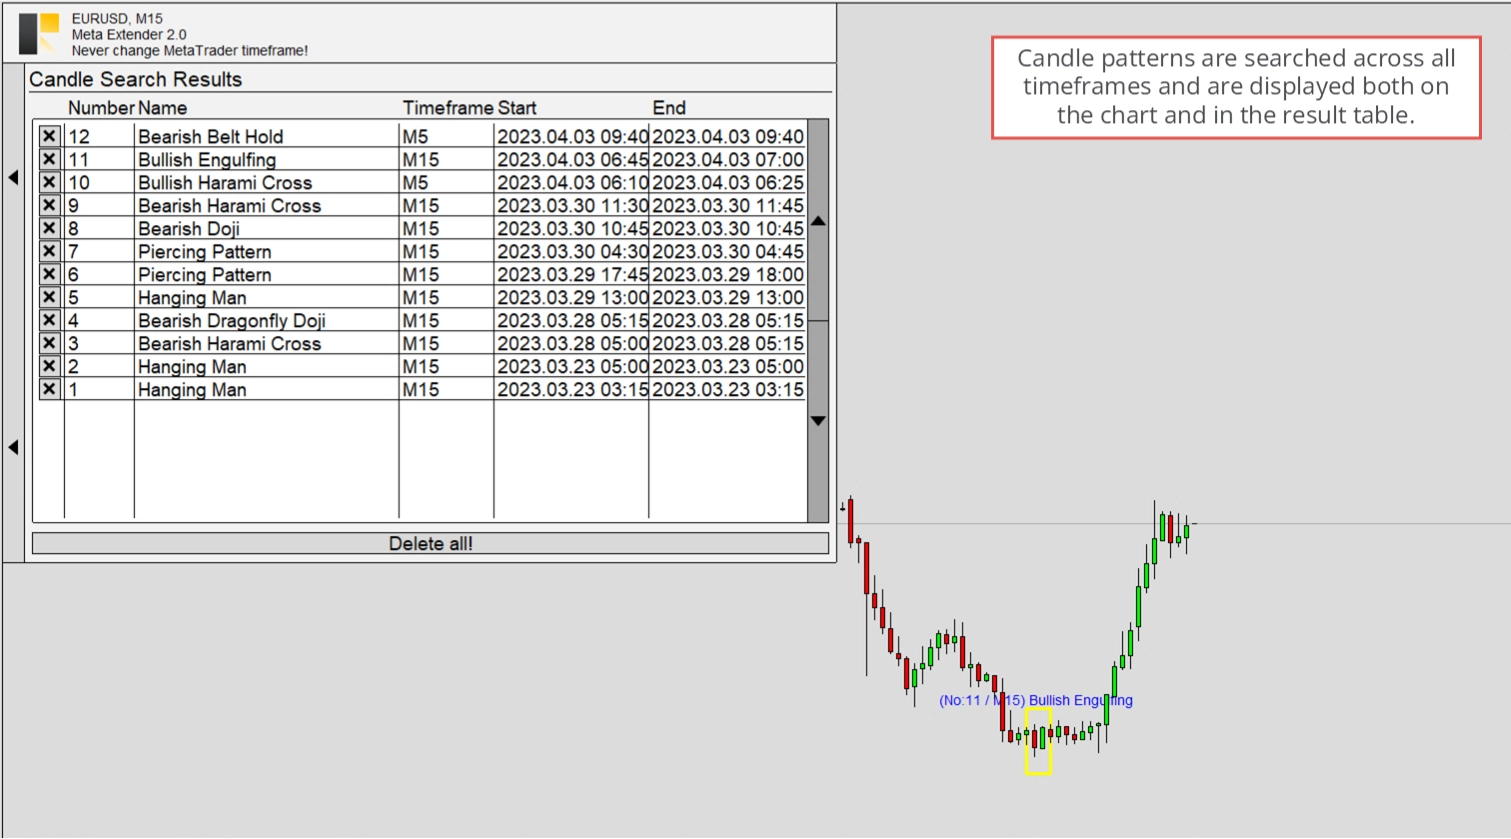
The search results in higher and lower timeframes are only visible when the relevant timeframe is enabled as the Second Timeframe. This will then look similar to the image below.
Please look into the FAQ section to understand which pattern will be available for search next.
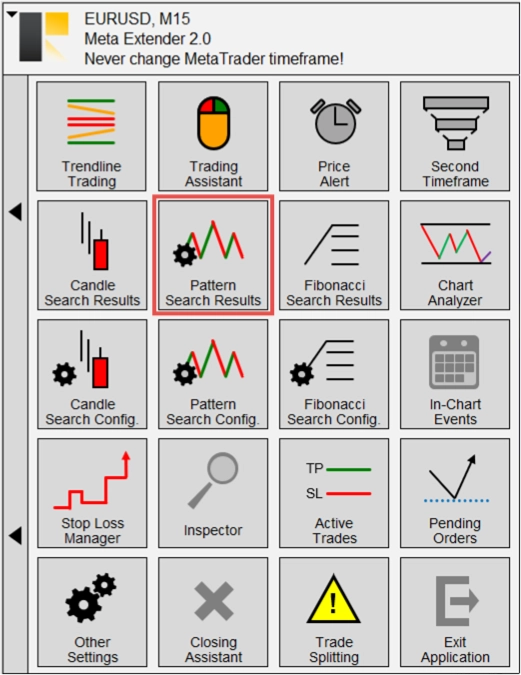
Pattern Search Results
The Meta Extender has a search engine that identifies commonly known chart patterns on the chart. These patterns are searched across all timeframes simultaneously. Each identified pattern is conveniently listed in a table. To access this widget, please press the Pattern Search Results button on your home screen.
You can view all the search results and have the option to delete them individually or clear the entire search history.
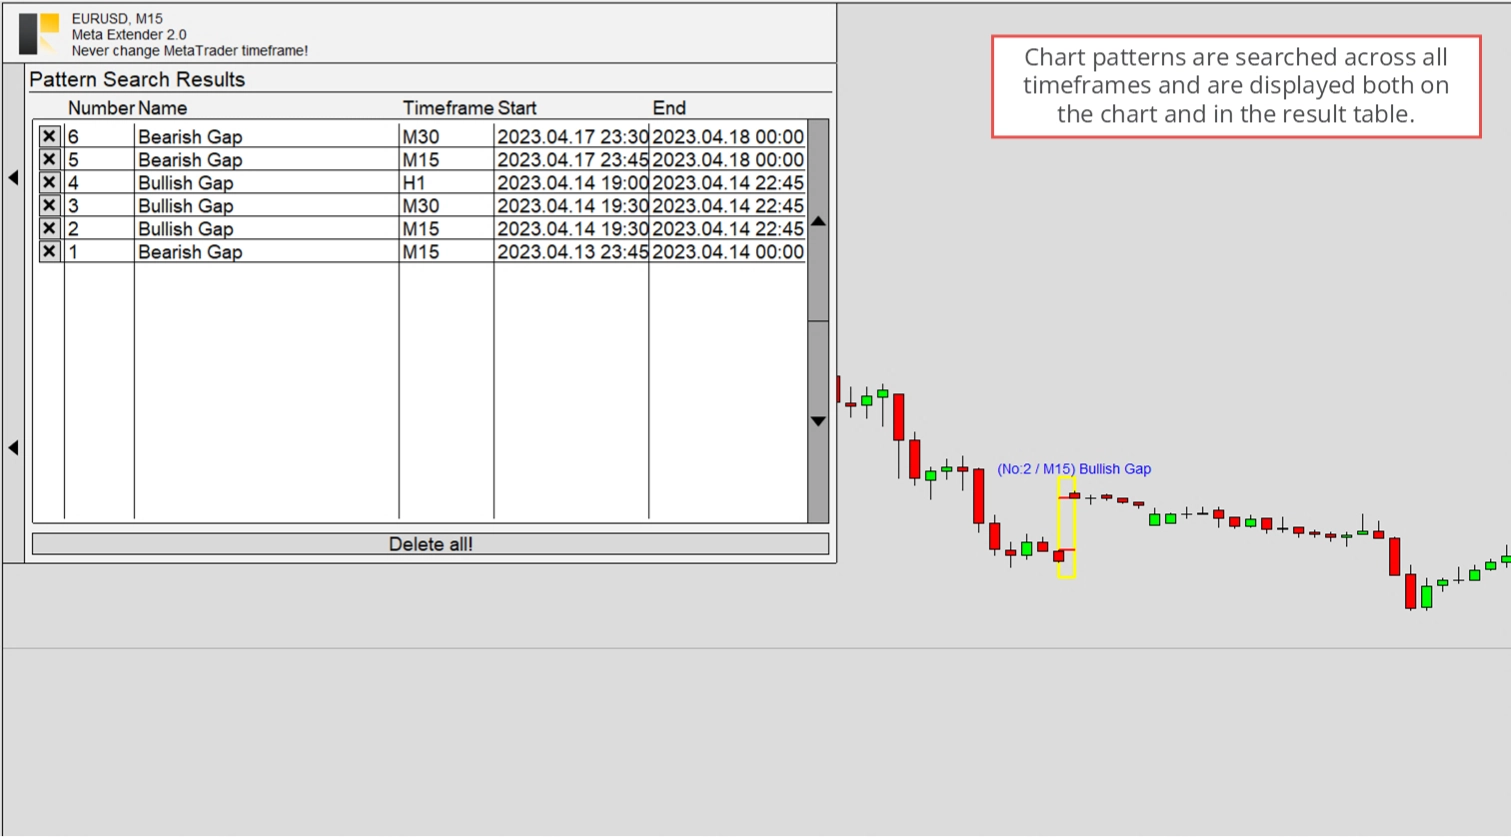
The search results in higher and lower timeframes are only visible when the relevant timeframe is enabled as the Second Timeframe. This will then look similar to the image below.

Please look into the FAQ section to understand which pattern will be available for search next.
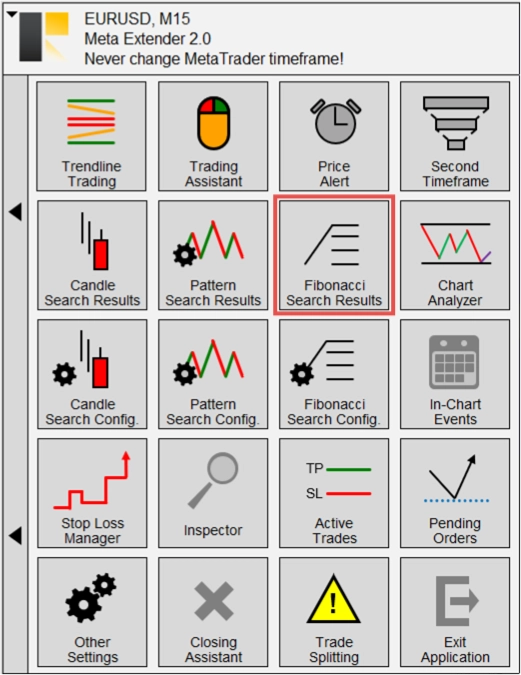
Fibonacci Search Results
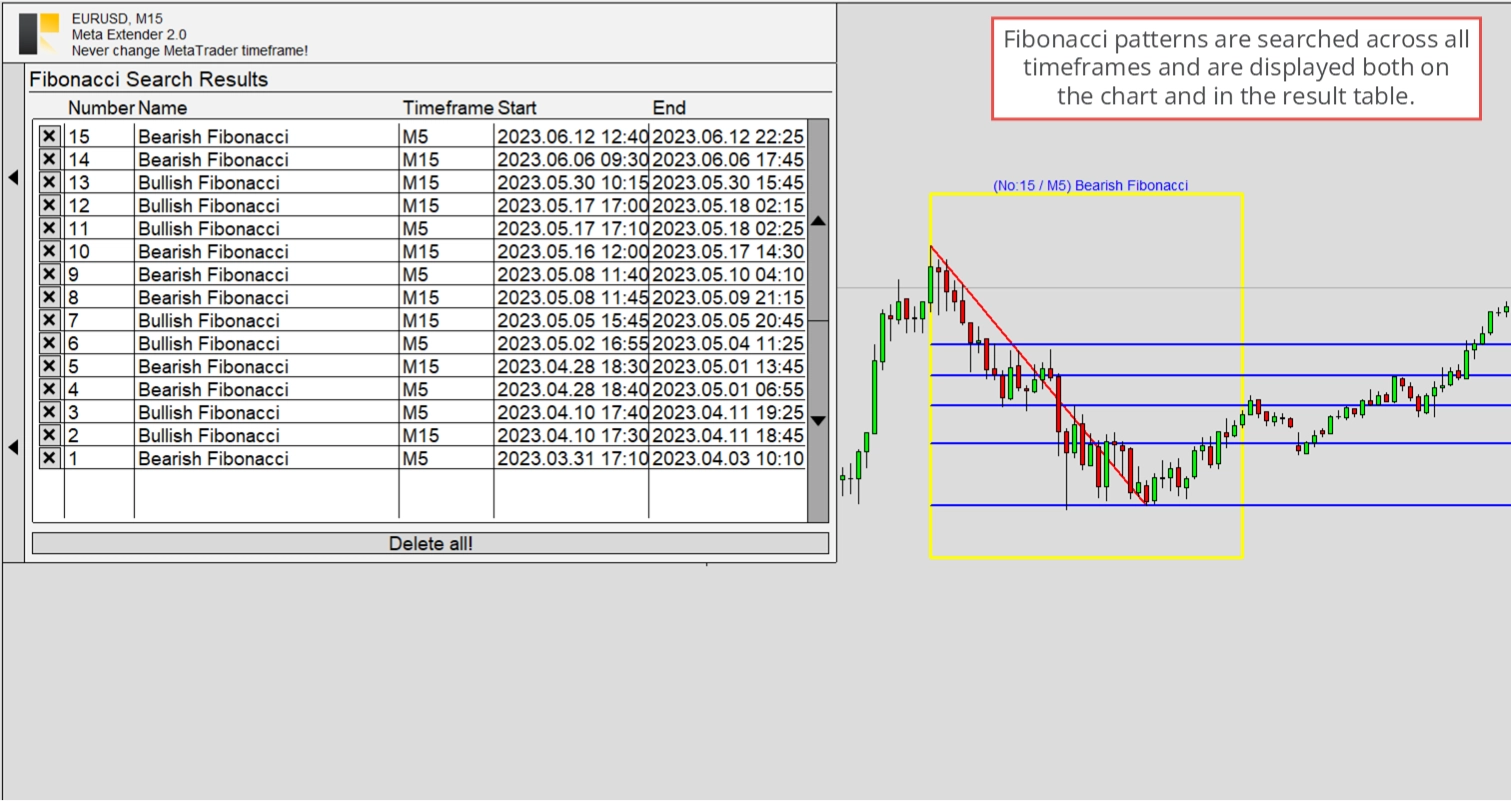
The Meta Extender has a search engine that identifies commonly known Fibonacci patterns on the chart. These patterns are searched across all timeframes simultaneously. Each identified pattern is conveniently listed in a table. To access this widget, please press the Fibonacci Search Results button on your home screen.
You can view all the search results and have the option to delete them individually or clear the entire search history.
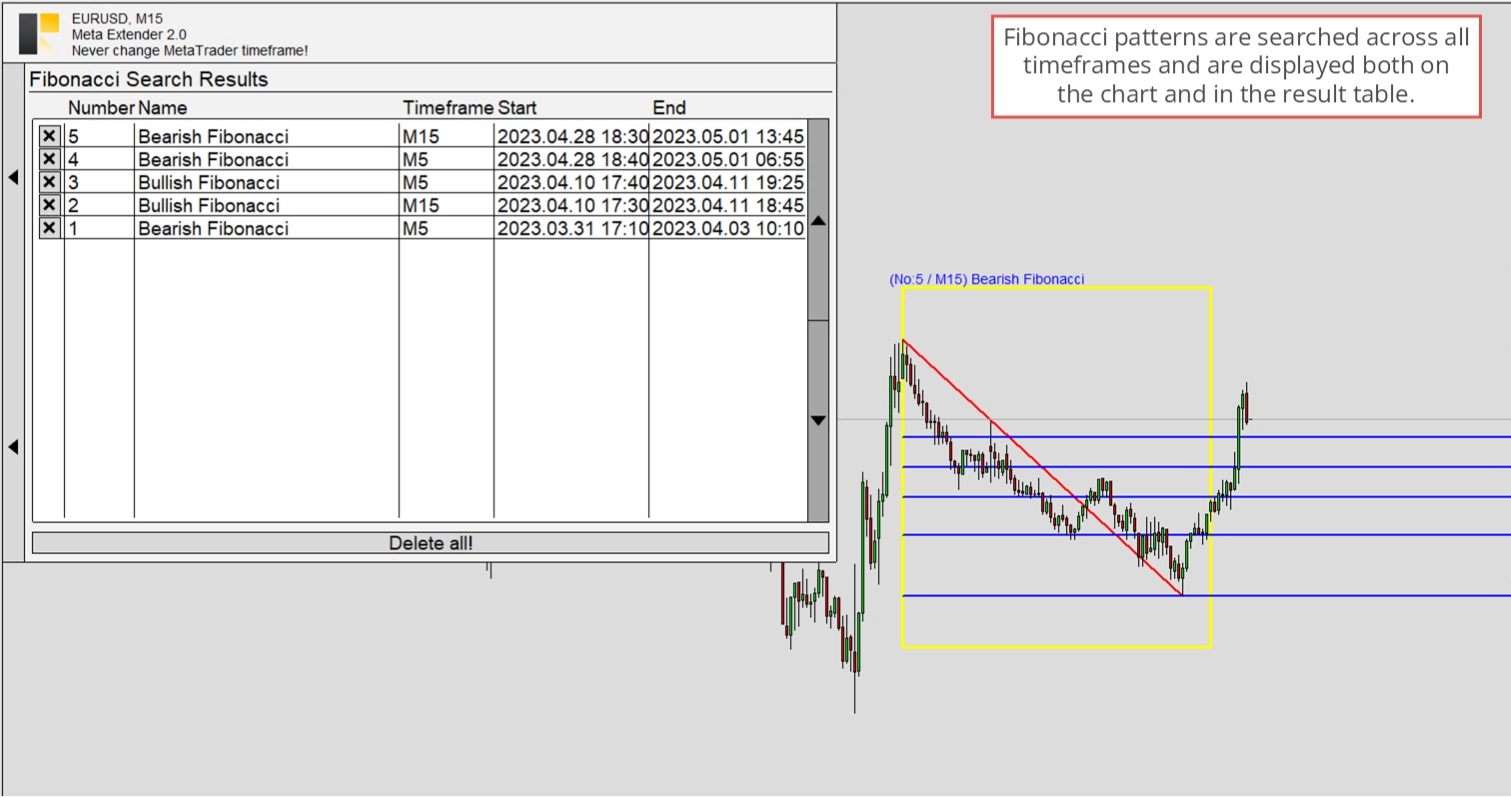
The search results in higher and lower timeframes are only visible when the relevant timeframe is enabled as the Second Timeframe. This will then look similar to the image below.
Please look into the FAQ section to understand which pattern will be available for search next.
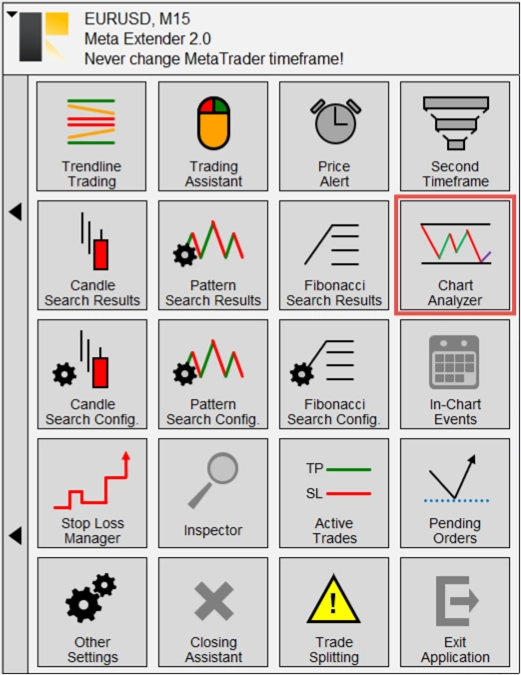
Chart Analyzer
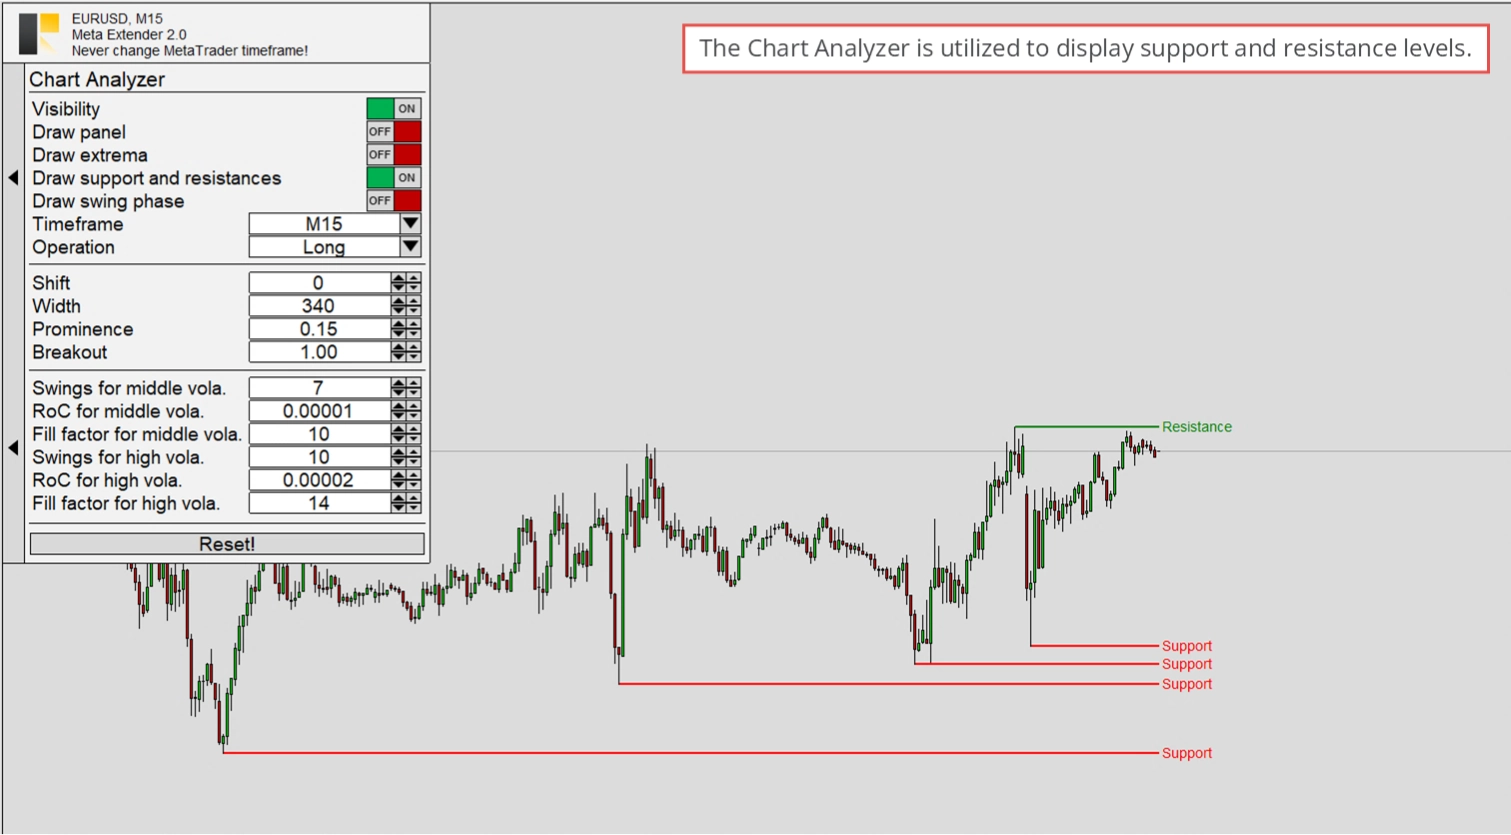
The Chart Analyzer widget is a highly interactive tool that enables you to analyze the current chart for support and resistance levels and provides numerous settings for convenient analysis of the current market phase, retracement level, and more. All input parameters can be adjusted while the application is active.
To access the widget, select Chart Analyzer on your home screen.
The widget includes various input settings, which are divided into parameters for turning visual elements on and off, configuring the precision of the analysis, and adjusting for volatility detection. Generally, the default values are already optimized, and there's no need for adjustments. However, you can use the provided inputs to make changes. The analyzed area will be updated immediately according to the latest configured parameters.
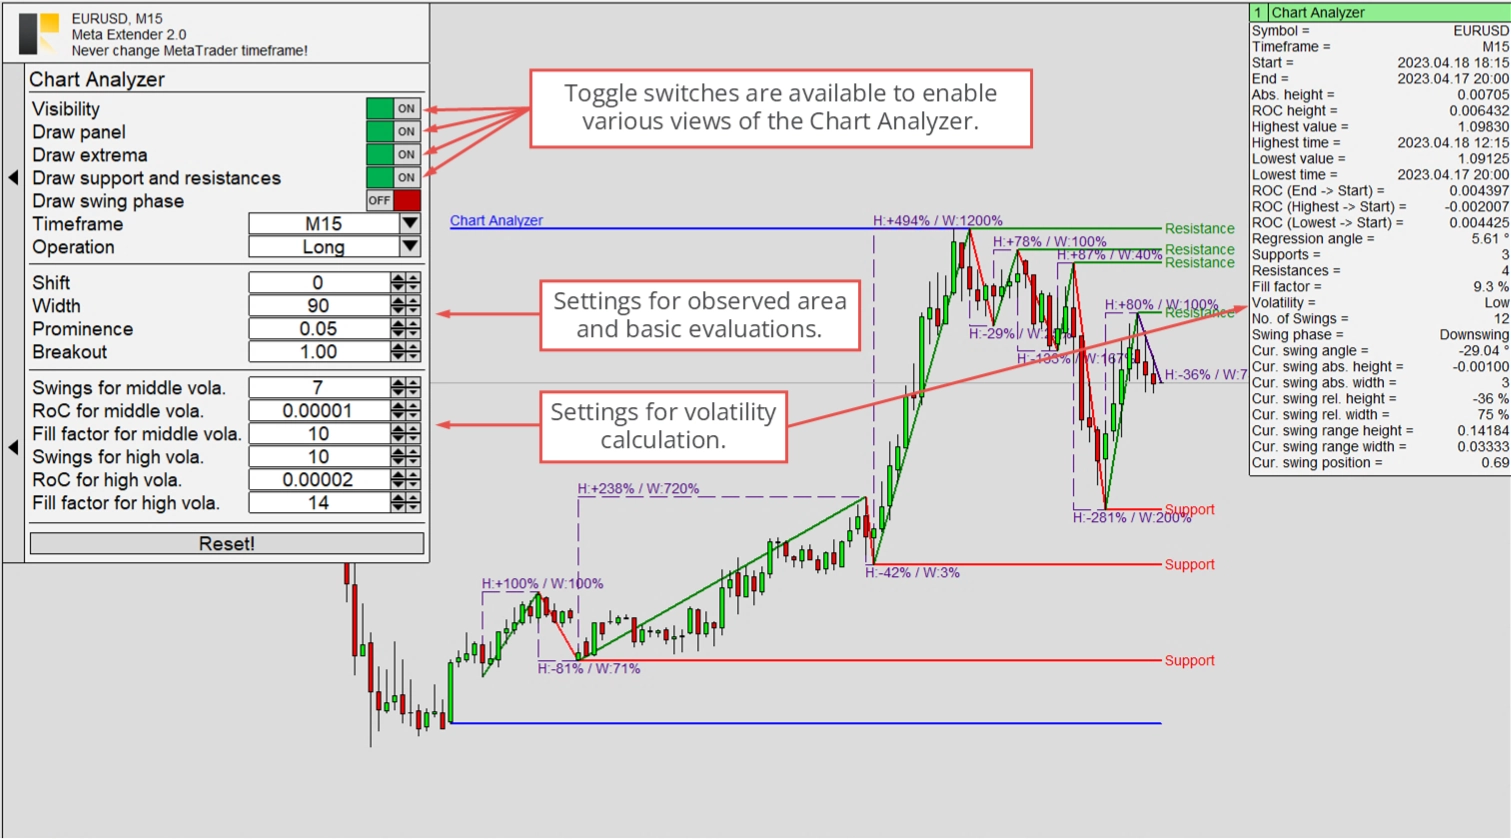
For instance, if you analyze only support and resistance levels, the chart output will look like the following.
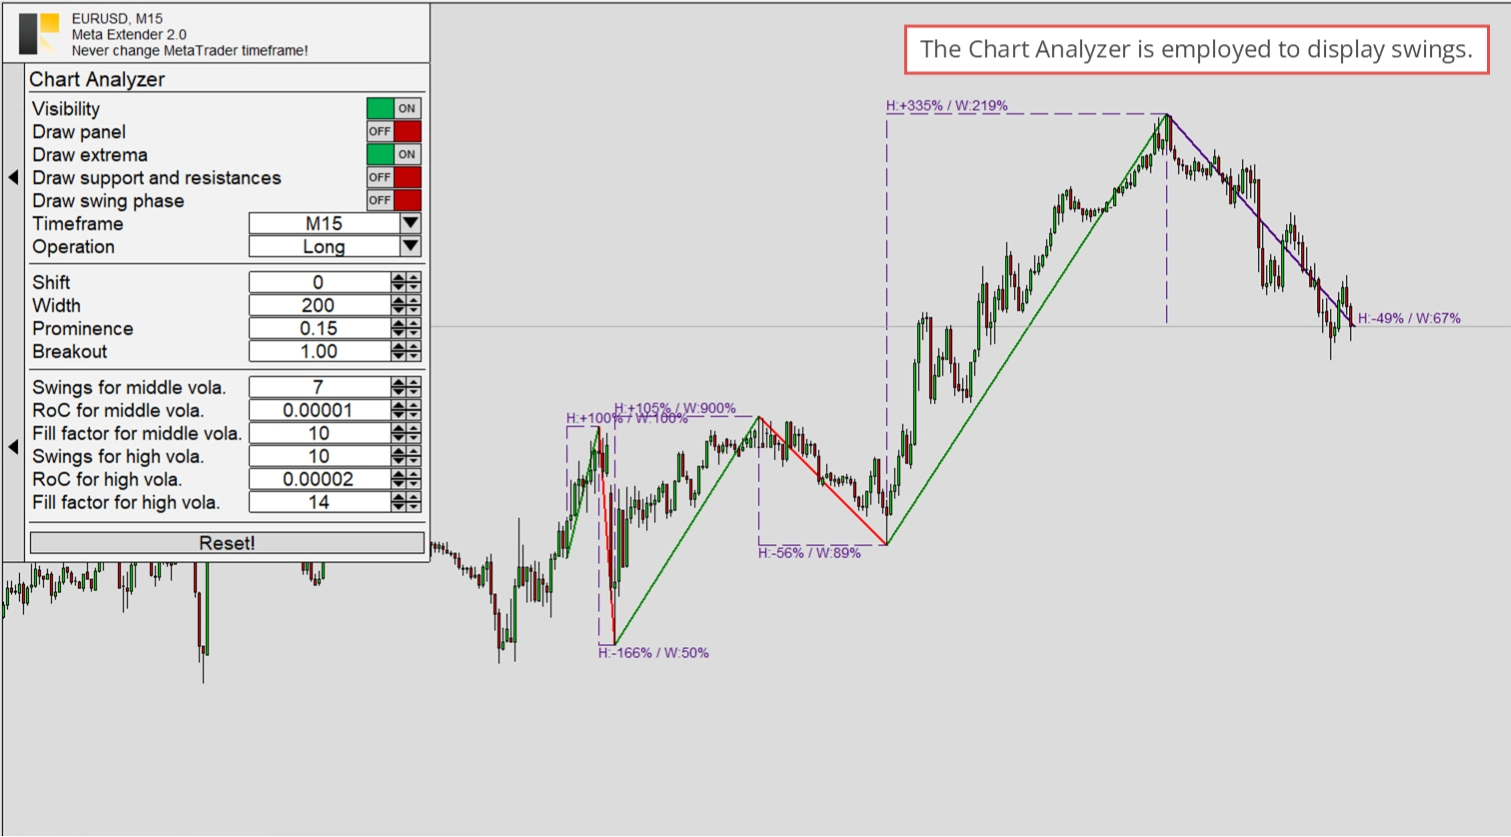
Another option is to calculate and display only the swing phases (ZigZag) and the value of relative changes between each swing.
The configuration of the Chart Analyzer is saved automatically. Thus, the next time you start the Meta Extender on the same symbol again, your Chart Analyzer will automatically restore the previous configuration.
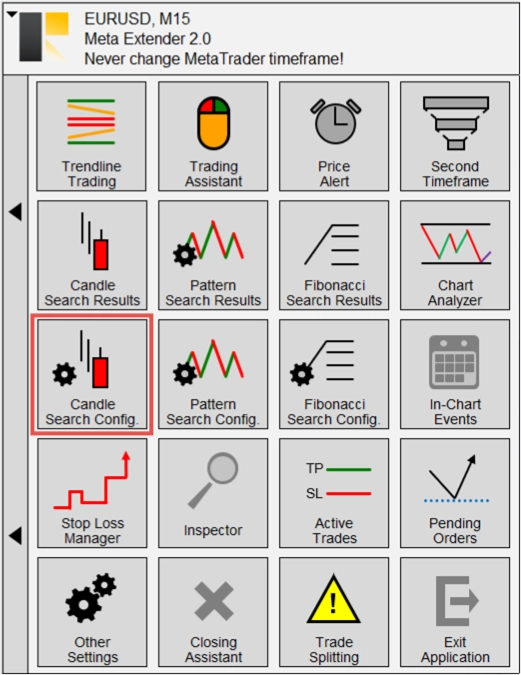
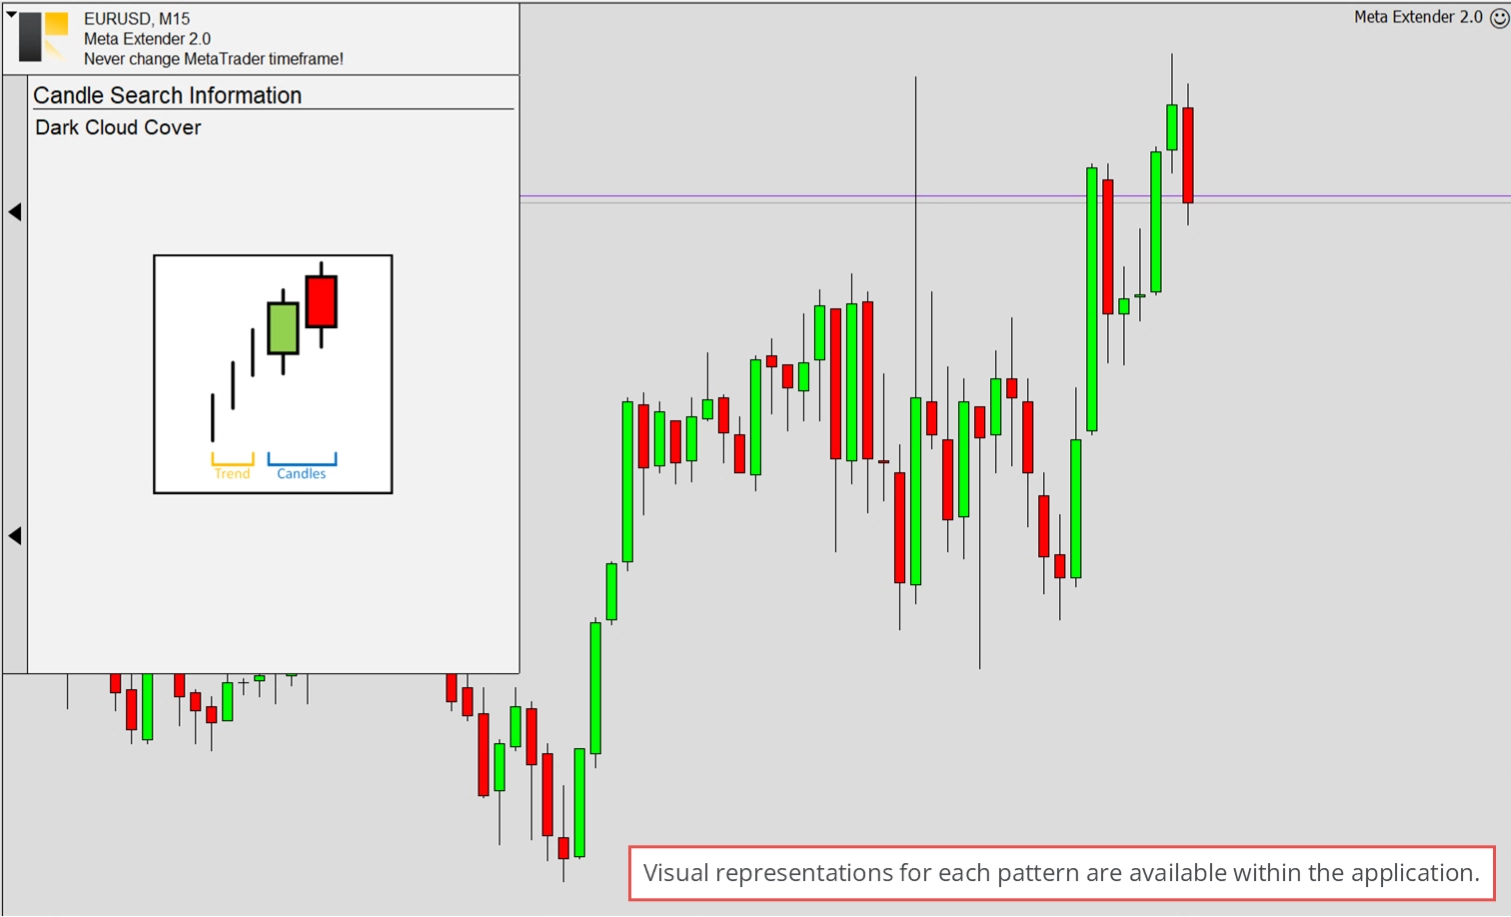
Candle Search Config
The candle search engine can simultaneously identify patterns across all timeframes. However, you may only want to search for some of them. To customize this, navigate to Candle Search Config, where you can turn each pattern on or off individually.
In this view, you can scroll through all available patterns and disable them for each timeframe individually. These settings will be saved and restored the next time you restart the application on the same symbol.
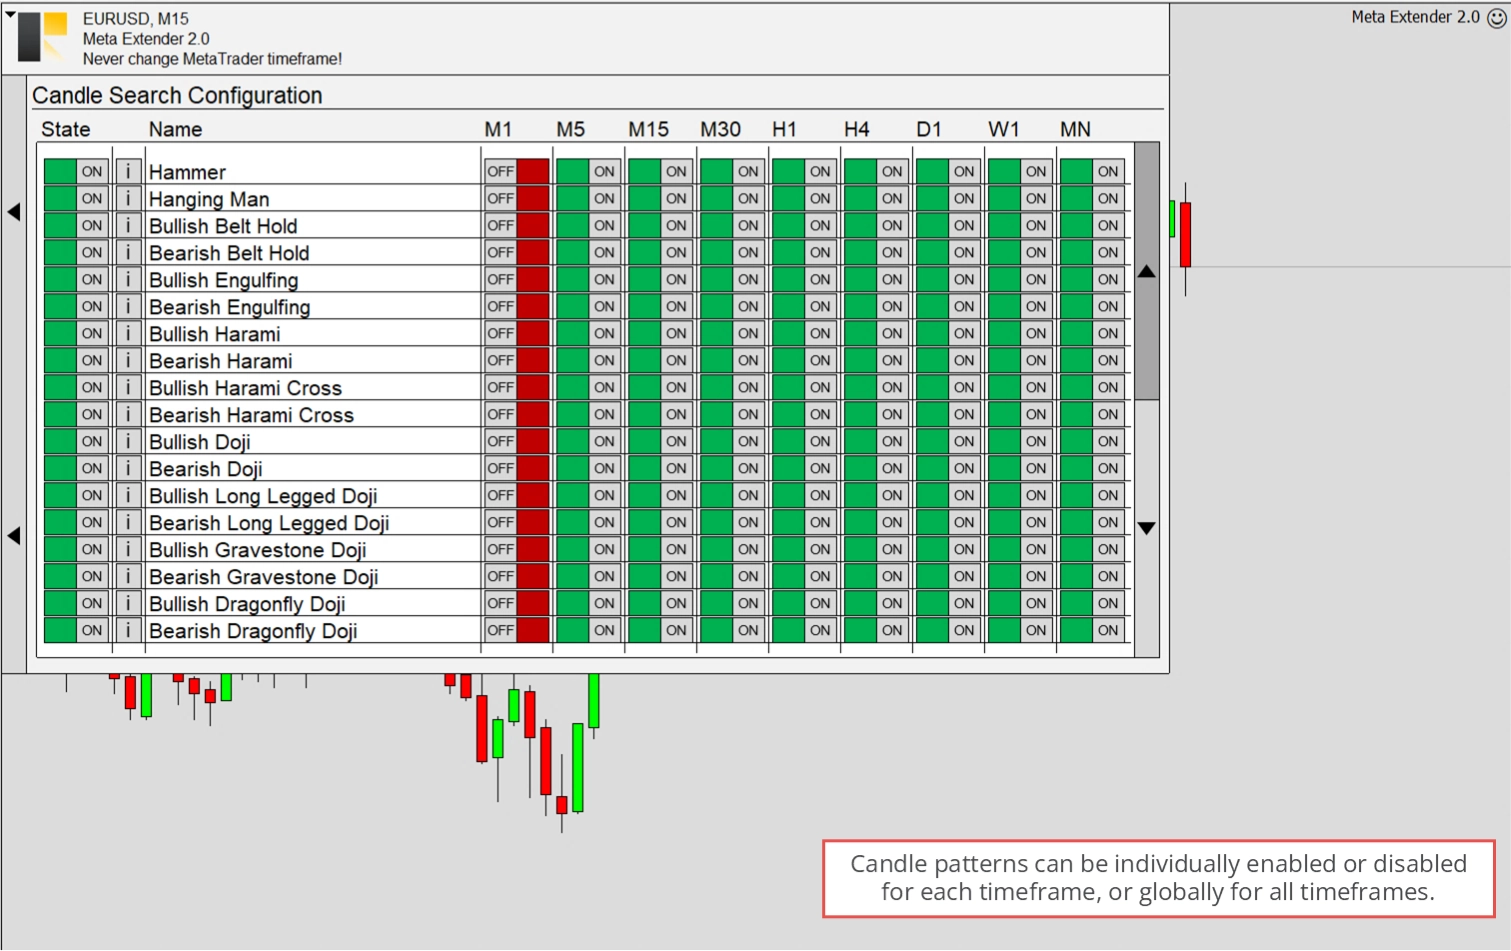
By clicking on the info button, you can view a simple illustration of what each pattern roughly looks like.
The search engine is continuously extended. If a pattern is missing, rest assured that it will be added soon!
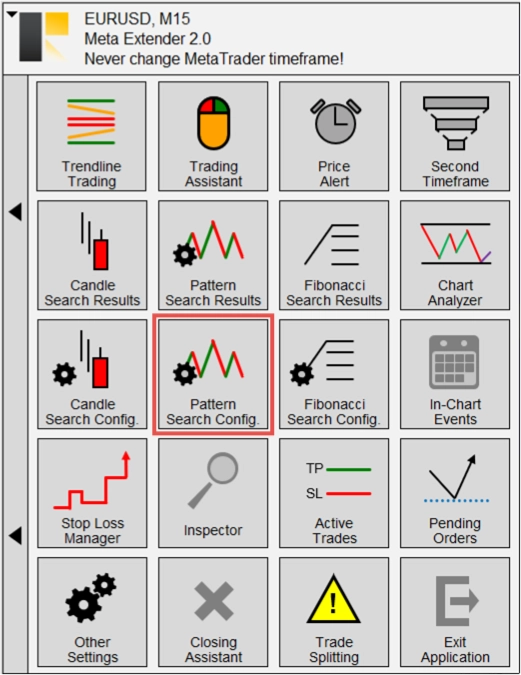
Pattern Search Config
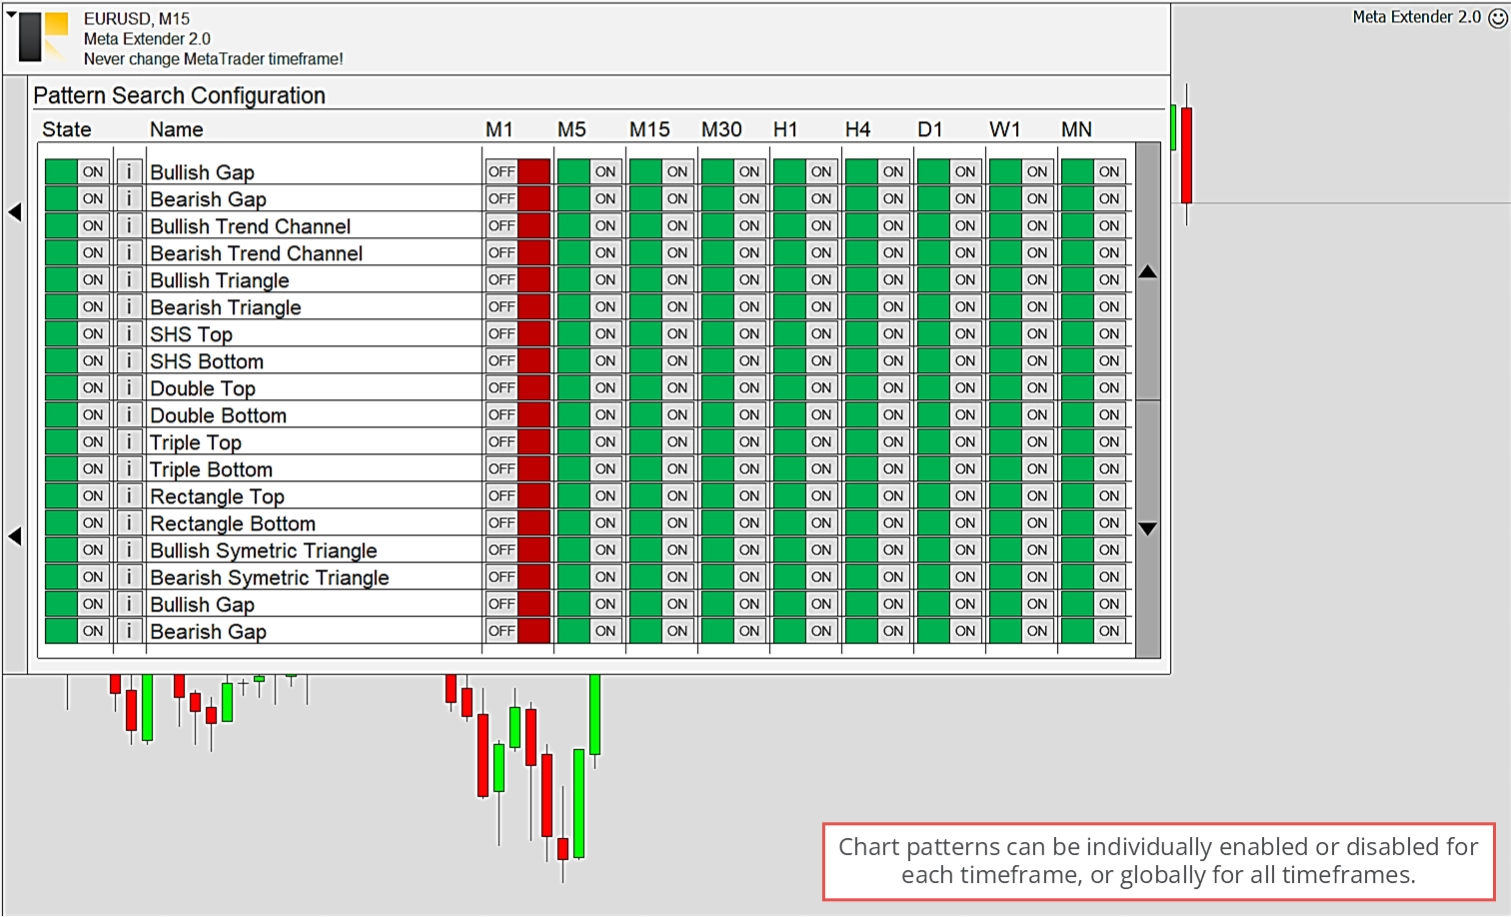
The pattern search engine can simultaneously identify patterns across all timeframes. However, you may only want to search for some of them. To customize this, navigate to Pattern Search Config, where you can turn each pattern on or off individually.
In this view, you can scroll through all available patterns and disable them for each timeframe individually. These settings will be saved and restored the next time you restart the application on the same symbol.
By clicking on the info button, you can view a simple illustration of what each pattern roughly looks like.
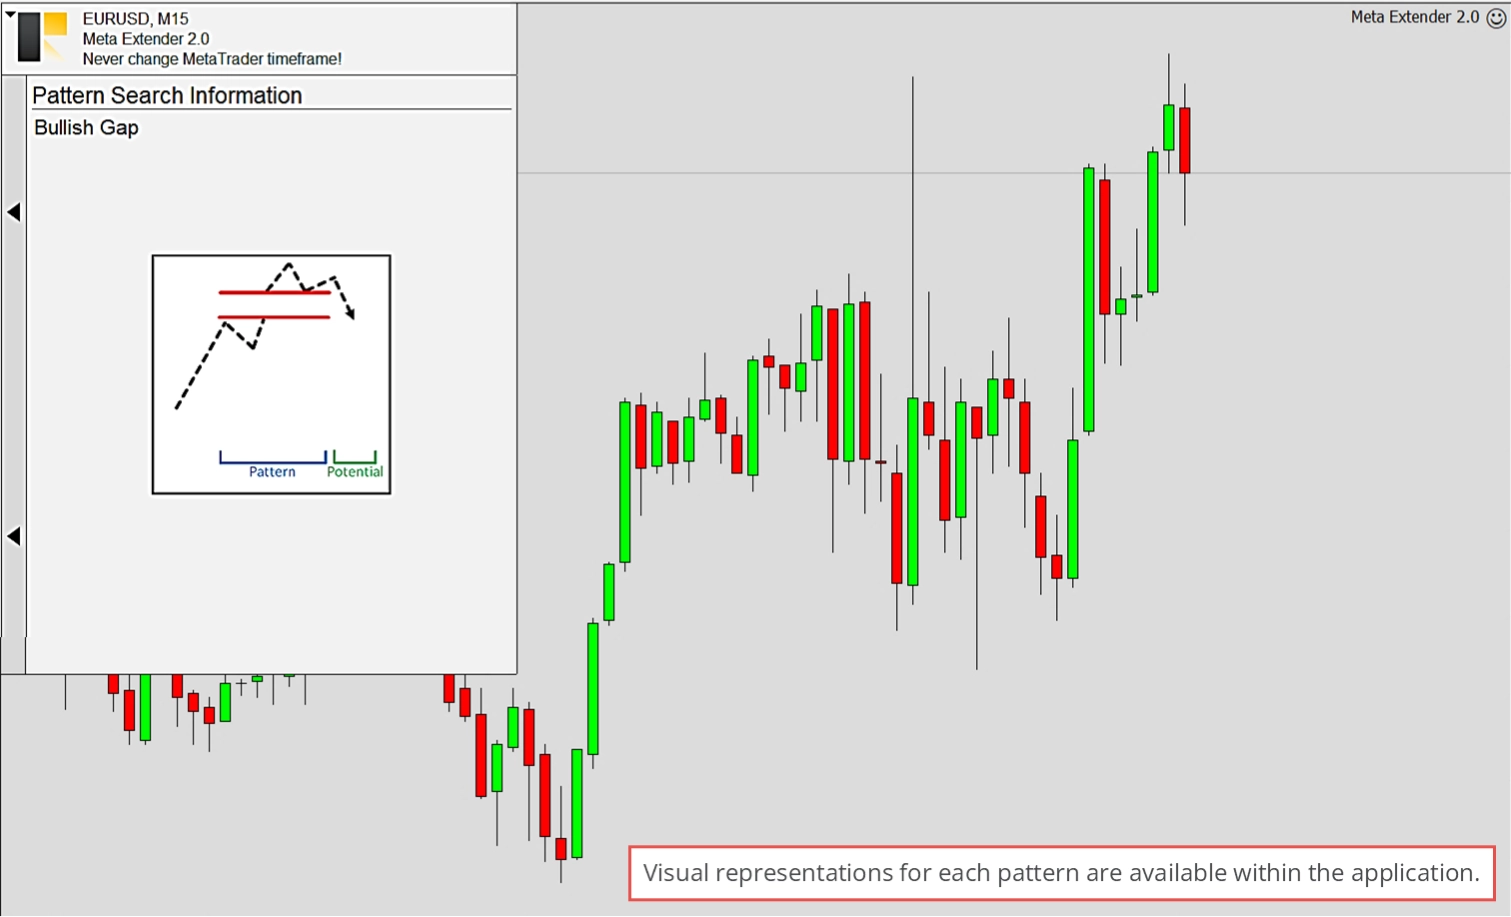
The search engine is continuously extended. If a pattern is missing, rest assured that it will be added soon!
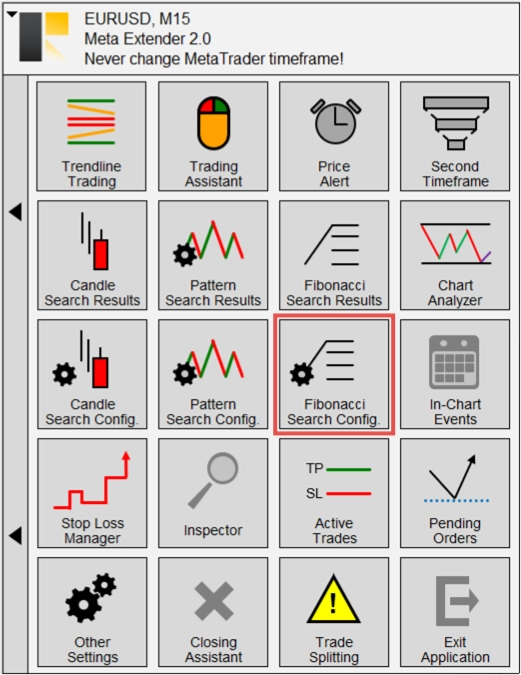
Fibonacci Search Config
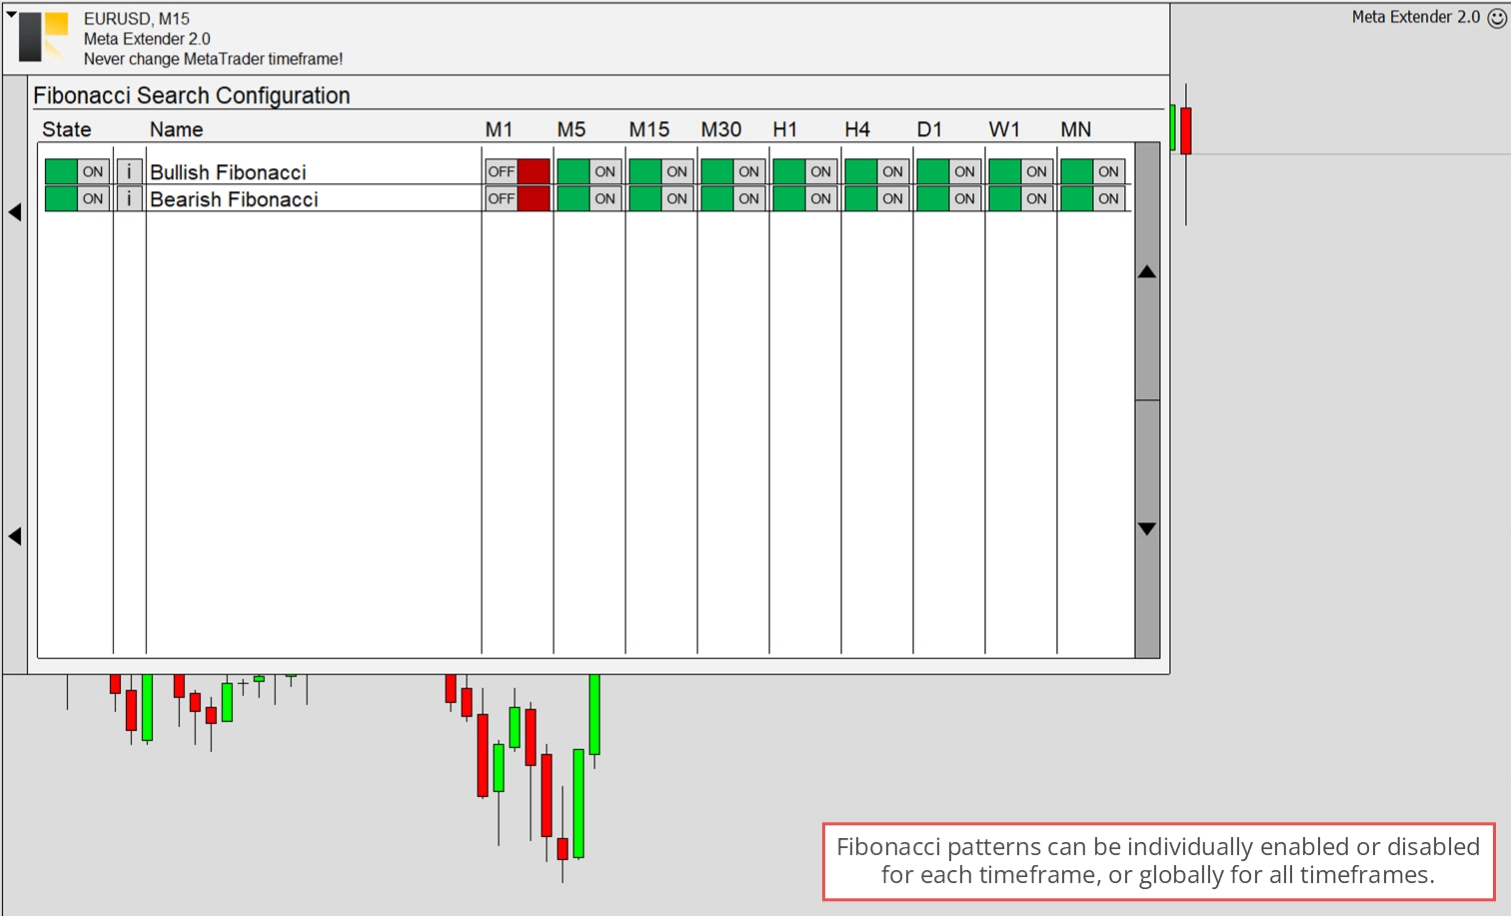
The Fibonacci search engine can simultaneously search and identify patterns across all timeframes. However, you may only want to search for them. To customize this, navigate to Fibonacci Search Config, where you can turn each pattern on or off individually.
In this view, you can scroll through all available patterns and disable them for each timeframe individually. These settings will be saved and restored the next time you restart the application on the same symbol.
By clicking on the info button, you can view a simple illustration of what each pattern roughly looks like.
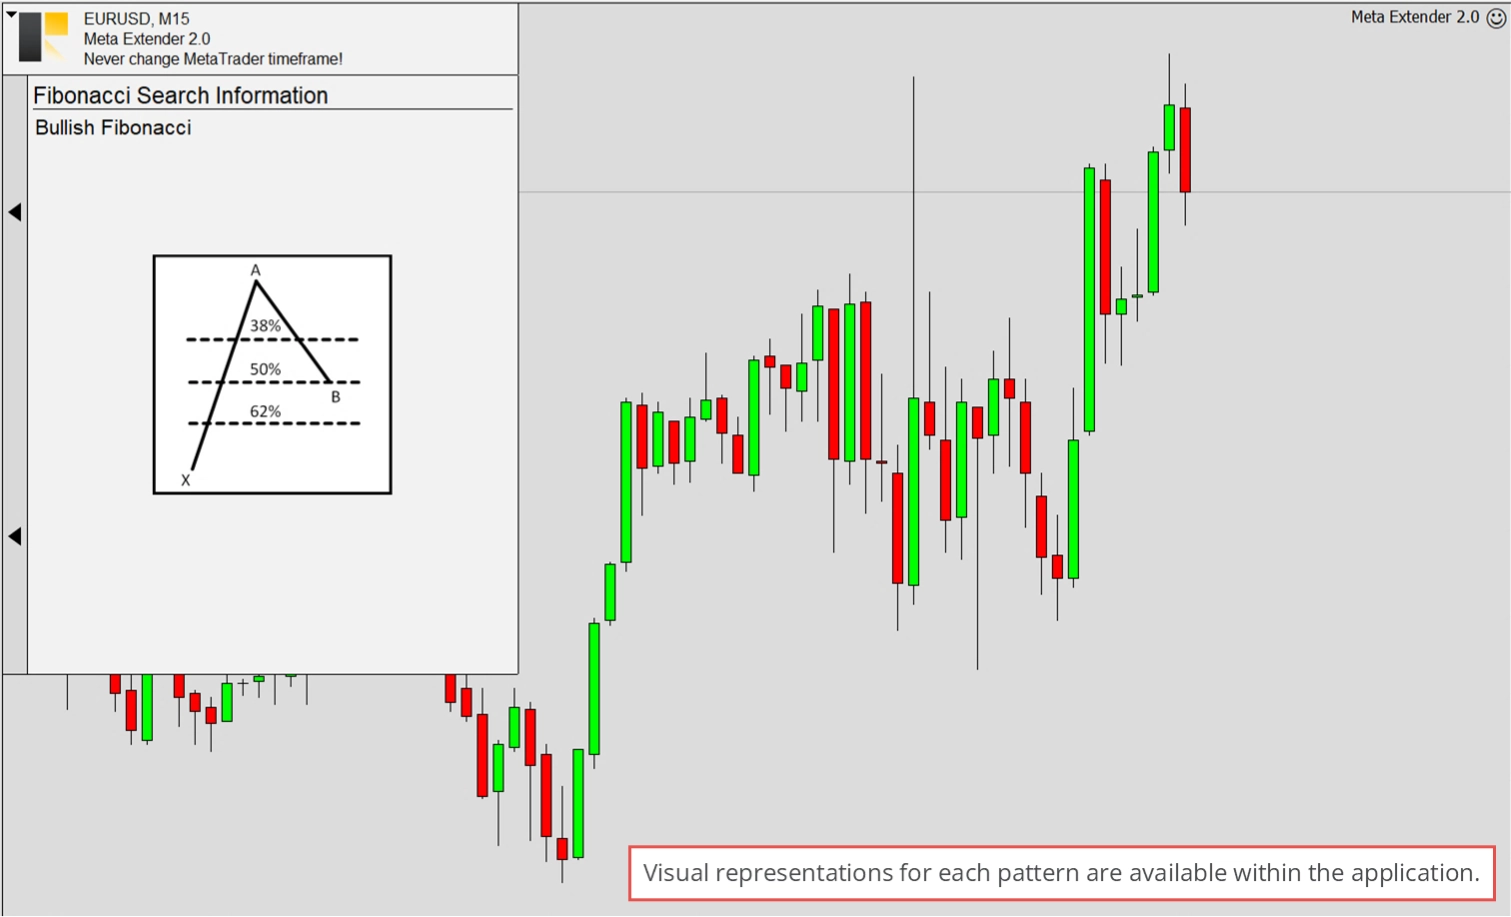
The search engine is continuously extended. If a pattern is missing, rest assured that it will be added soon!
In-Chart Events
Undoubtedly, the latest news is one of the most critical factors to consider when trading based on market analysis. Various economic indicators are regularly released and often significantly impact many charts. For instance, the US unemployment rate influences the EURUSD exchange rate greatly, depending on whether the actual results match the forecasts.
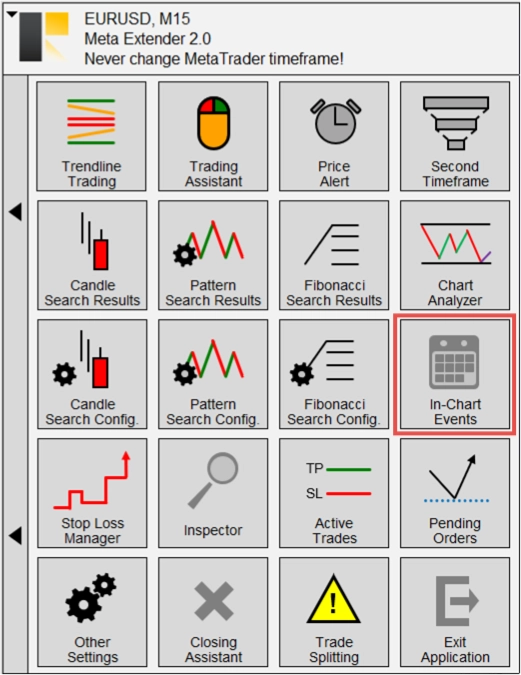
MetaTrader 5 has a built-in economic calendar to inform you about all news events. Unfortunately, MetaTrader 4 has not had this feature until now! The Meta Extender widget In-Chart Events allows you to conveniently integrate all types of news as a table or as horizontal lines. This means you will never miss an important news event again, as Meta Extender will display it right in the chart.
To open the In-Chart Events, please navigate accordingly on your Meta Extender home screen.
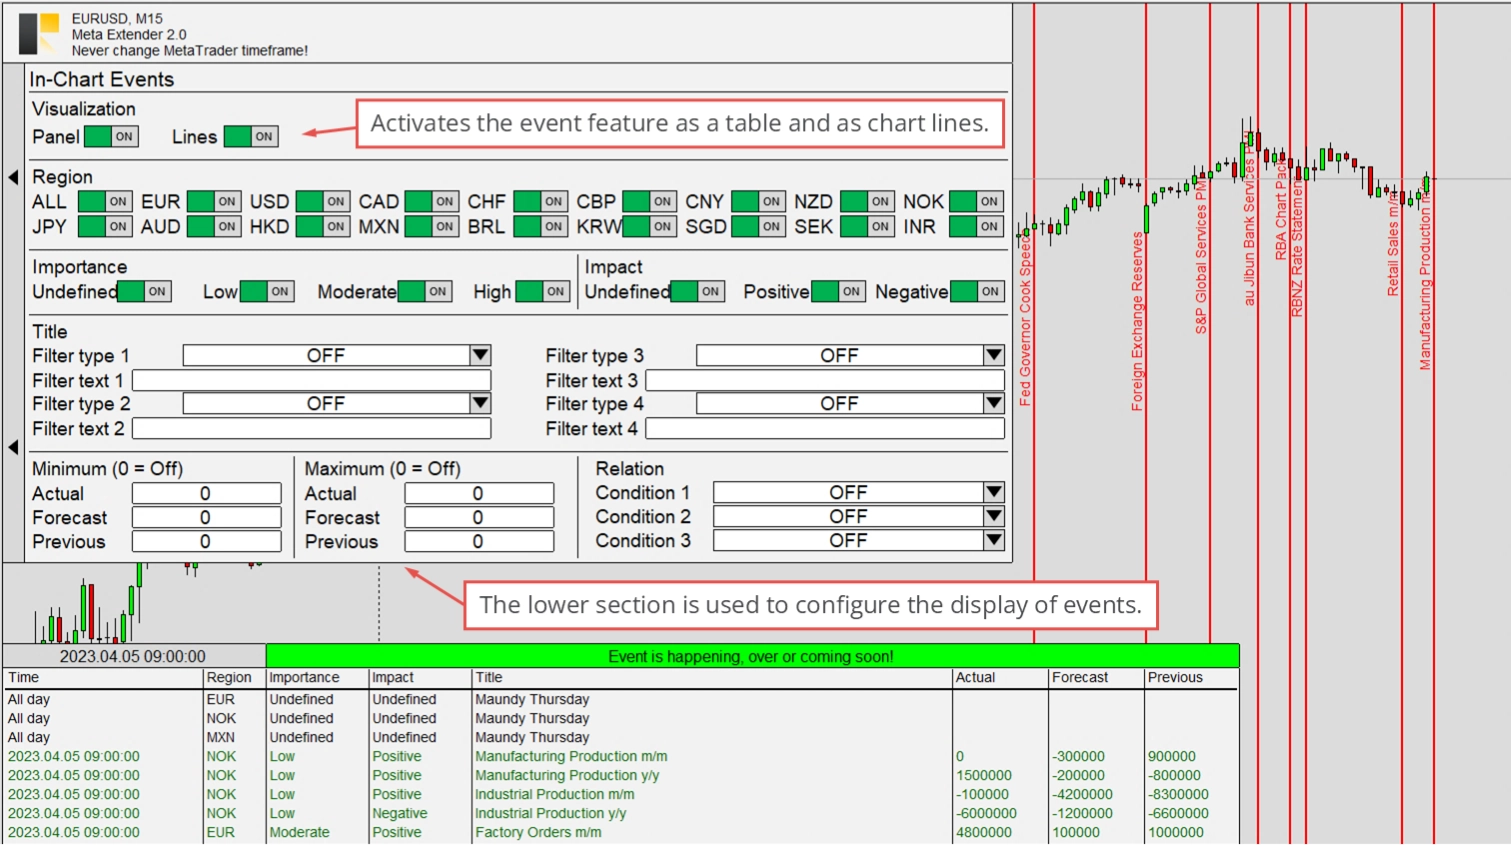
Under Visualization, you can enable the table and the in-chart lines, as shown in the image below, using the switches.
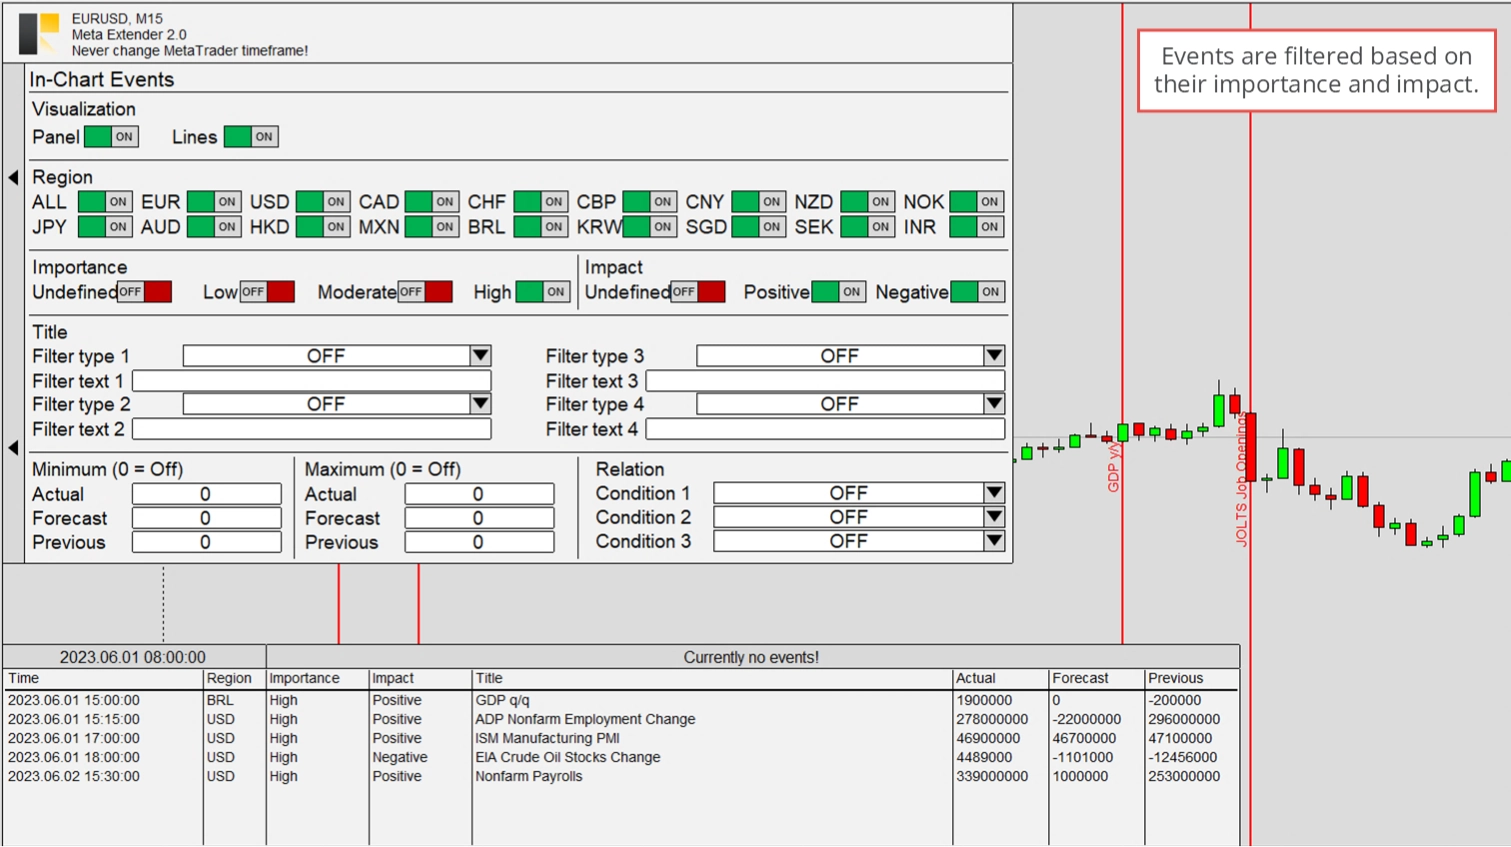
Other filter options for event importance and impact are available as on-off switches. Feel free to get familiar with the feature by using your MetaTrader strategy tester to find the events that matter for your trading strategy.
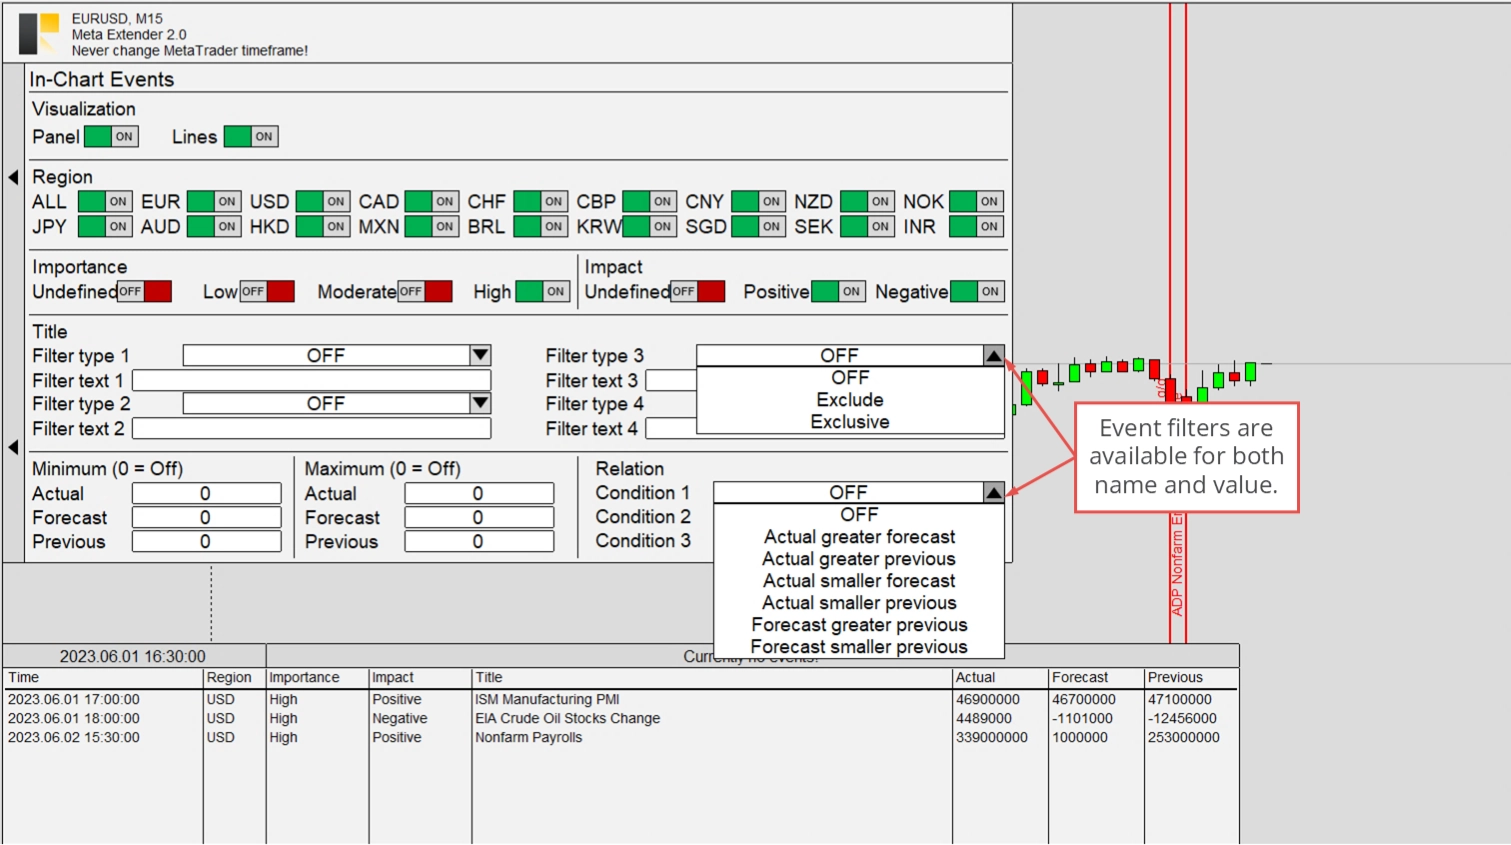
Other filters are available for the event name and the actual value. The parameters listed in the Title section allow you to filter for the names of the events. Here, you can select between Exclude and Exclusive mode. Exclude means that all the events that contain the value from the input field are excluded from the news event list. In contrast, the exclusive mode means only events with the input text contained are shown. For example, if you wish only to be informed about ECB news events, please set Filter type 1 to Exclusive and enter ECB in the Filter text 1 input field.
With the Minimum, Maximum, and Relation input parameters, you can define how the actual, forecast, and previous values have to be in absolute or in relation to each other. For example, by selecting Actual greater than previous you get shown only news events where the value of the economic indicator has risen.
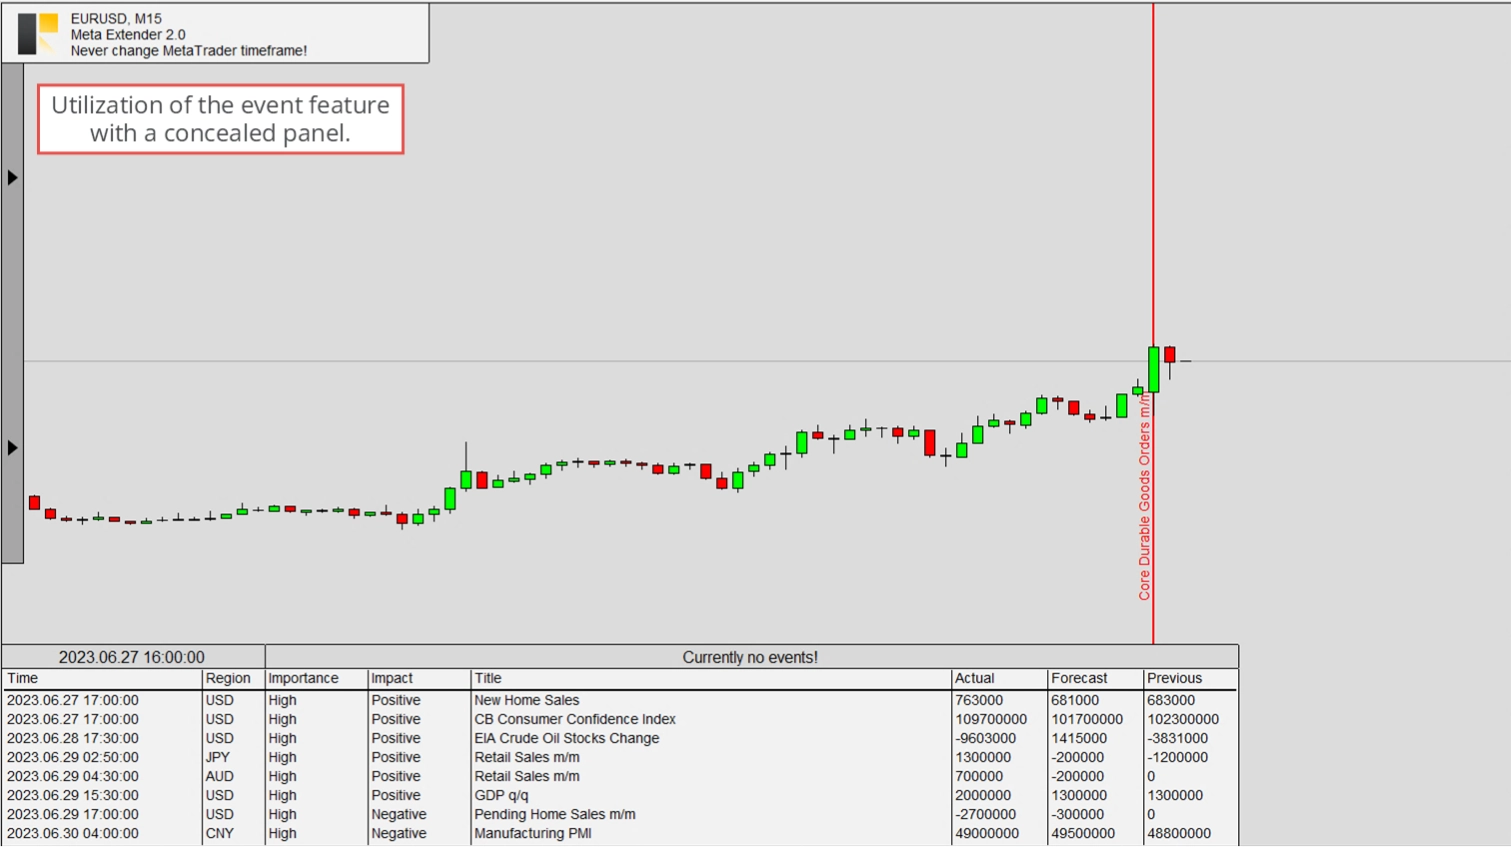
The latest news will significantly impact some traders' daily trading style. Therefore, you can configure the in-chart widgets and then hide the entire panel with the leftmost button.
Please note that news values can be delayed by seconds or minutes. This is due to external dependencies in receiving the economic calendar data.
Stop Loss Manager
The Stop Loss Manager technology, widely used across the product portfolio, is described below. This technology can function as a standalone tool, in fully automated trading systems, or as part of the Meta Extender. The Stop Loss Manager integrated into the Meta Extender offers professional capabilities to automate stop loss trailing. This includes the selection of the actual stop loss trailing method and even the transition between them once a trade is opened.
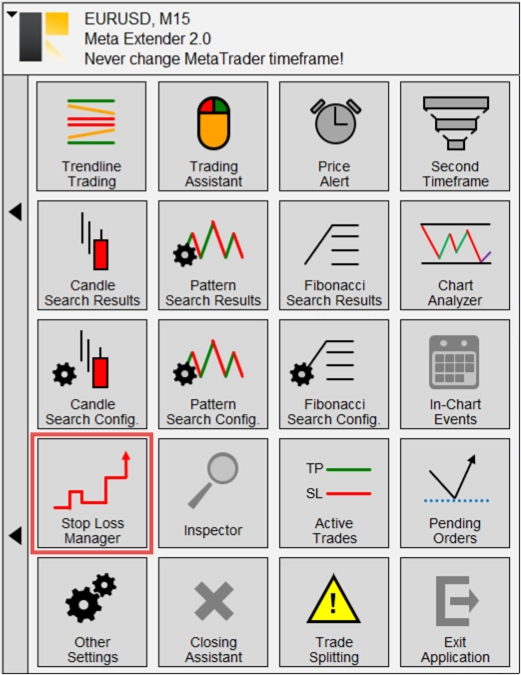
You can access the widgets by clicking the Stop Loss Manager button on your Meta Extender home screen.
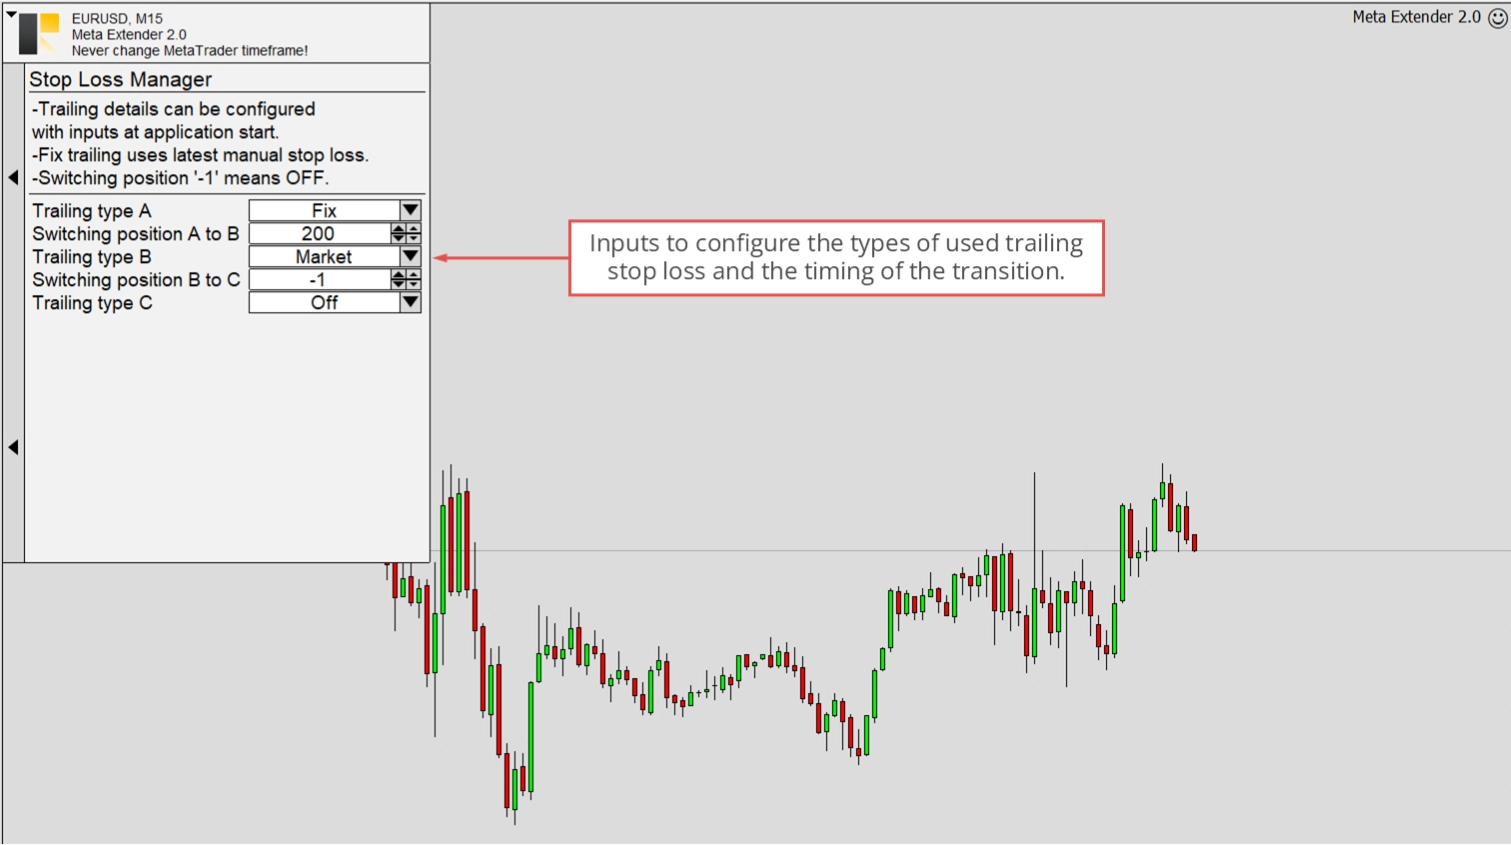
Once the trailing method is configured, it applies to the entire Meta Extender and every trade opened with it. In short, the window below serves as the settings window for the Stop Loss Manager. Some settings can be configured when the application starts, and some can be changed individually for each trade. This ensures that your stop loss characteristic remains reproducible. The following section focuses only on the changeable input parameters while executing the application. Please refer to this article to get information about the input parameters for the Stop Loss Manager that can be adjusted when the application starts.
As you can see below, the widget comes only with five input parameters. Three of them define the applied stop loss trailing methods (Trailing type A, Trailing type B, Trailing type C), and two represent when the switch between the trailing methods will take place. With these input parameters, it is easy to instruct the Meta Extender to start with a Breakeven trailing and activate the ATR-based stop loss trailing once the profit increases further. The configuration is stored for each opened trade individually, meaning you can change the parameters on this page according to the trade you wish to open next. Currently opened trades won't be influenced by changes on this page.
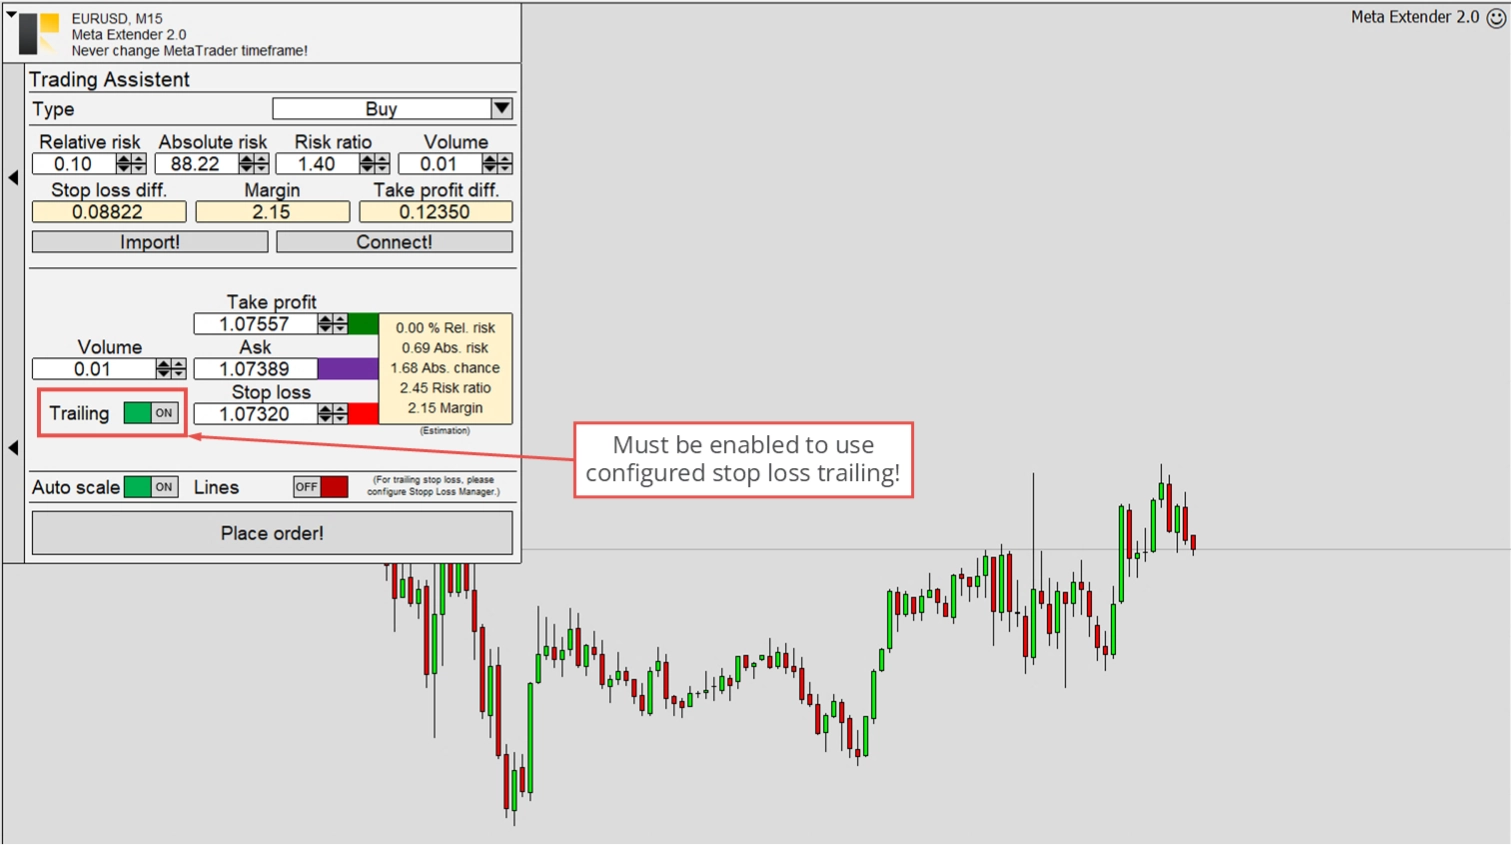
As already mentioned, this setting applies to the entire Meta Extender. This is particularly true for the Trading Assistant and Trendline Trading. To enable the stop loss manager for a new trade, the Trailing input switch in the Trading Assistant window has to be enabled. Only then is the Stop Loss Manager profile configuration taken into account. The trailing for the Trendline Trading widgets can also be allowed and disabled with this input switch.
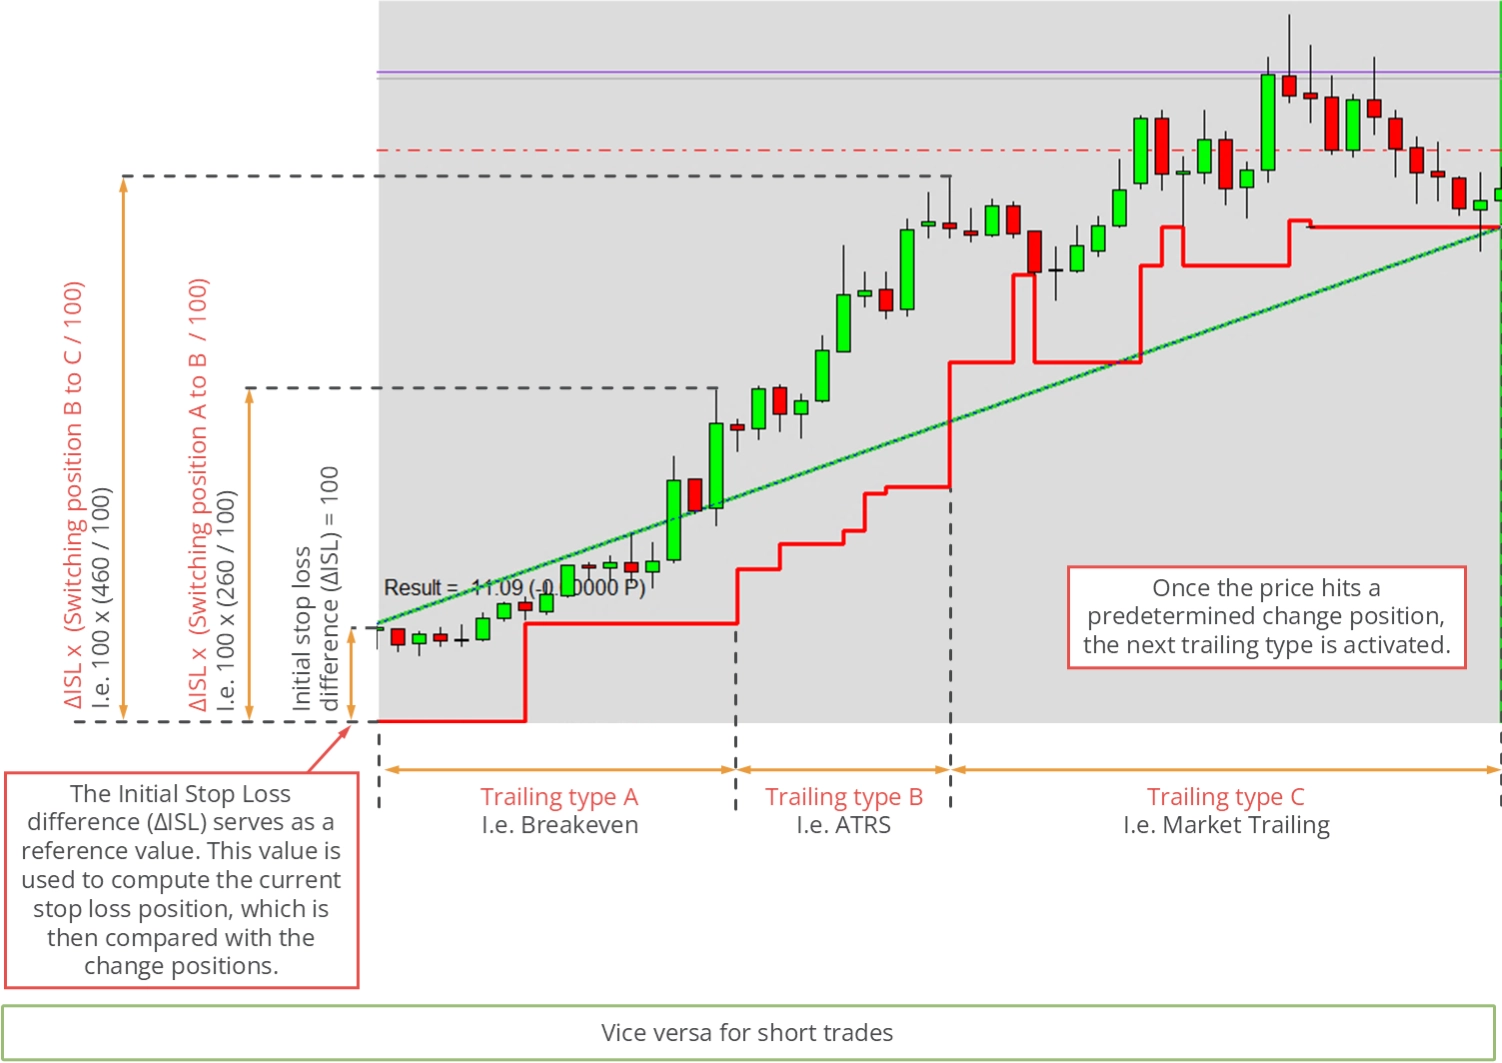
Please refer to the illustration below to understand how the Stop Loss Manager works. As you can see, this illustration displays a performed trade with enabled stop loss management. In the first phase of the trade, Breakeven trailing was active (Trailing type A). As soon as the trigger point (Switching position AB) for switching was reached, the Trailing type B (ATRS) became active. With further progress and reaching the next trigger point (Switching position BC), the Stop Loss Manager changes to the Market Trailing method (Trailing type C).
The switching position is defined as follows: The initial stop loss difference when a trade is opened represents the unitless value of 100; let's assume it has been 80 pips. When the Switching position AB is configured to 150, the actual change in trailing types occurs when the price reaches 120 pips above the initial stop loss. The initial stop loss is used as a static reference for this calculation.
You can choose from the following trailing types. Each trailing method can be used for different trading strategies. Some are indicator-based, and some are market-based:
- Off
- Fix
- Breakeven
- Market
- ATRS
- Parabolic SAR
- Stepwise
- Time closing
- Linear
- Last High/Low
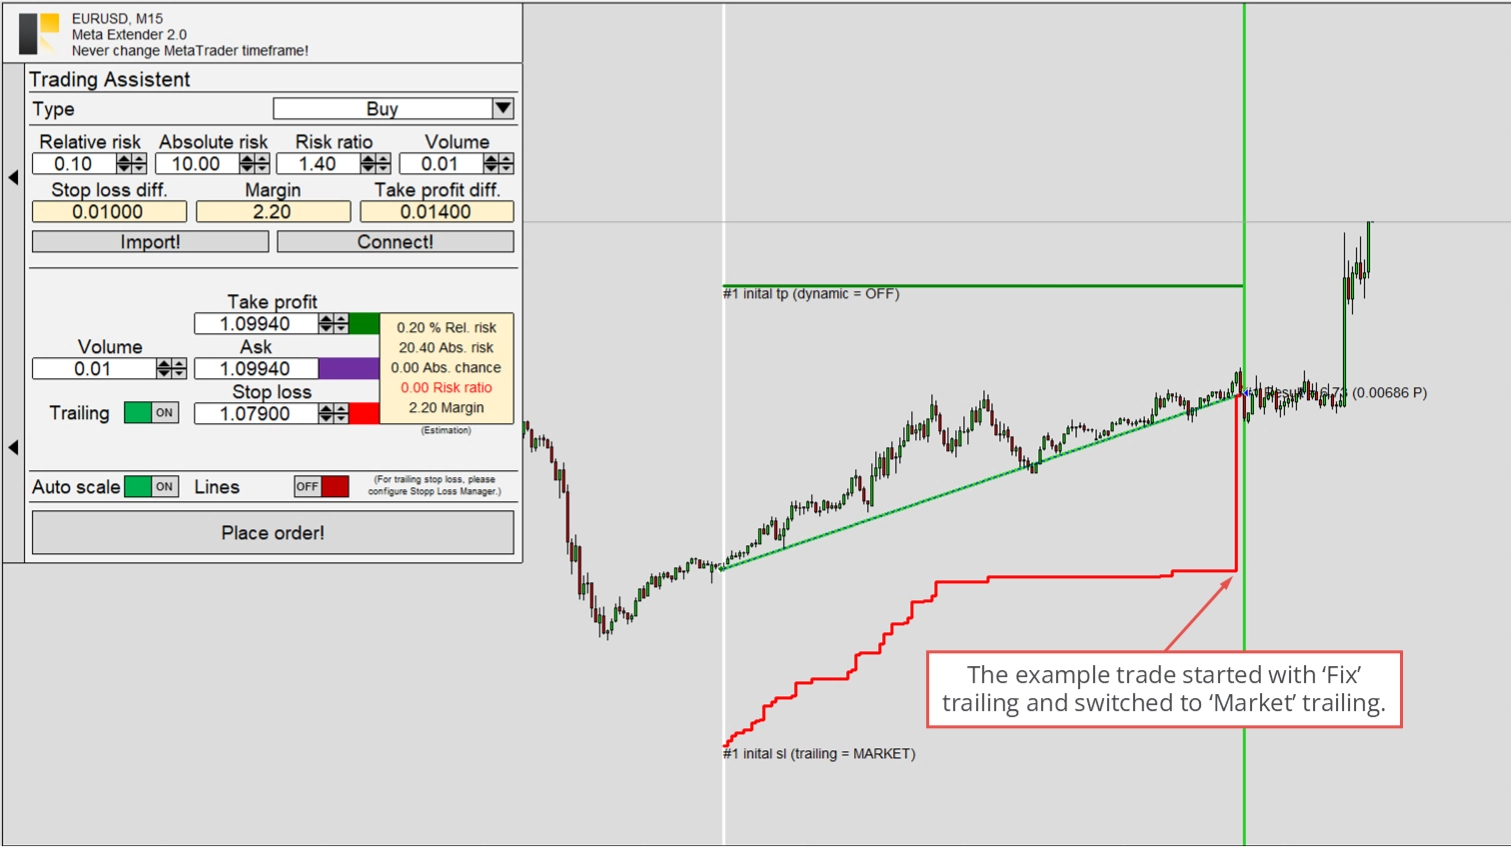
These methods can be combined to match your stop loss preference. The default setup is a fixed distance trailing and a relatively late switch to market trailing. This is useful for moving close to the current price when a significant profit is secured. This characteristic can be seen in the image below, which shows a trade opened with the Trading Assistant widget and enabled trailing.
Inspector
Self-awareness of current trading performance and drawdown is crucial for professional trading. While periods of negative results are regular, it's essential to ensure that long-term results are positive. This can be challenging, especially for day trading, with numerous positions opened and closed daily. To aid in understanding your performance and drawdown, the Meta Extender incorporates the Inspector engine. This algorithm continuously calculates real-time performance, drawdown, and statistics for various periods, keeping you updated.
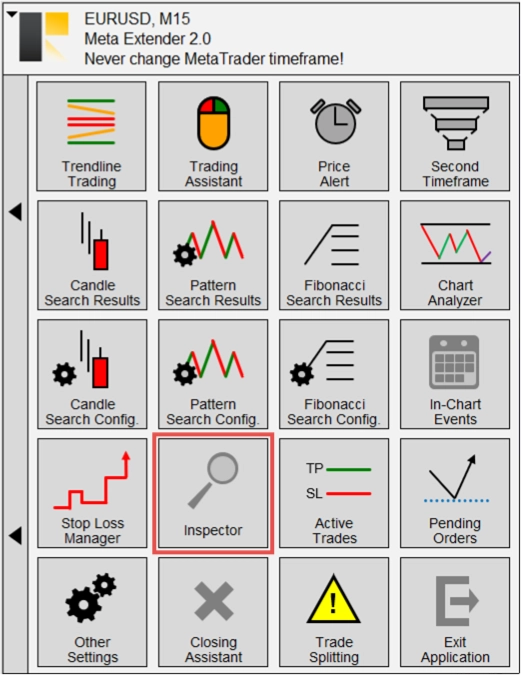
You can access the widget by navigating to Inspector from your Meta Extender home screen.
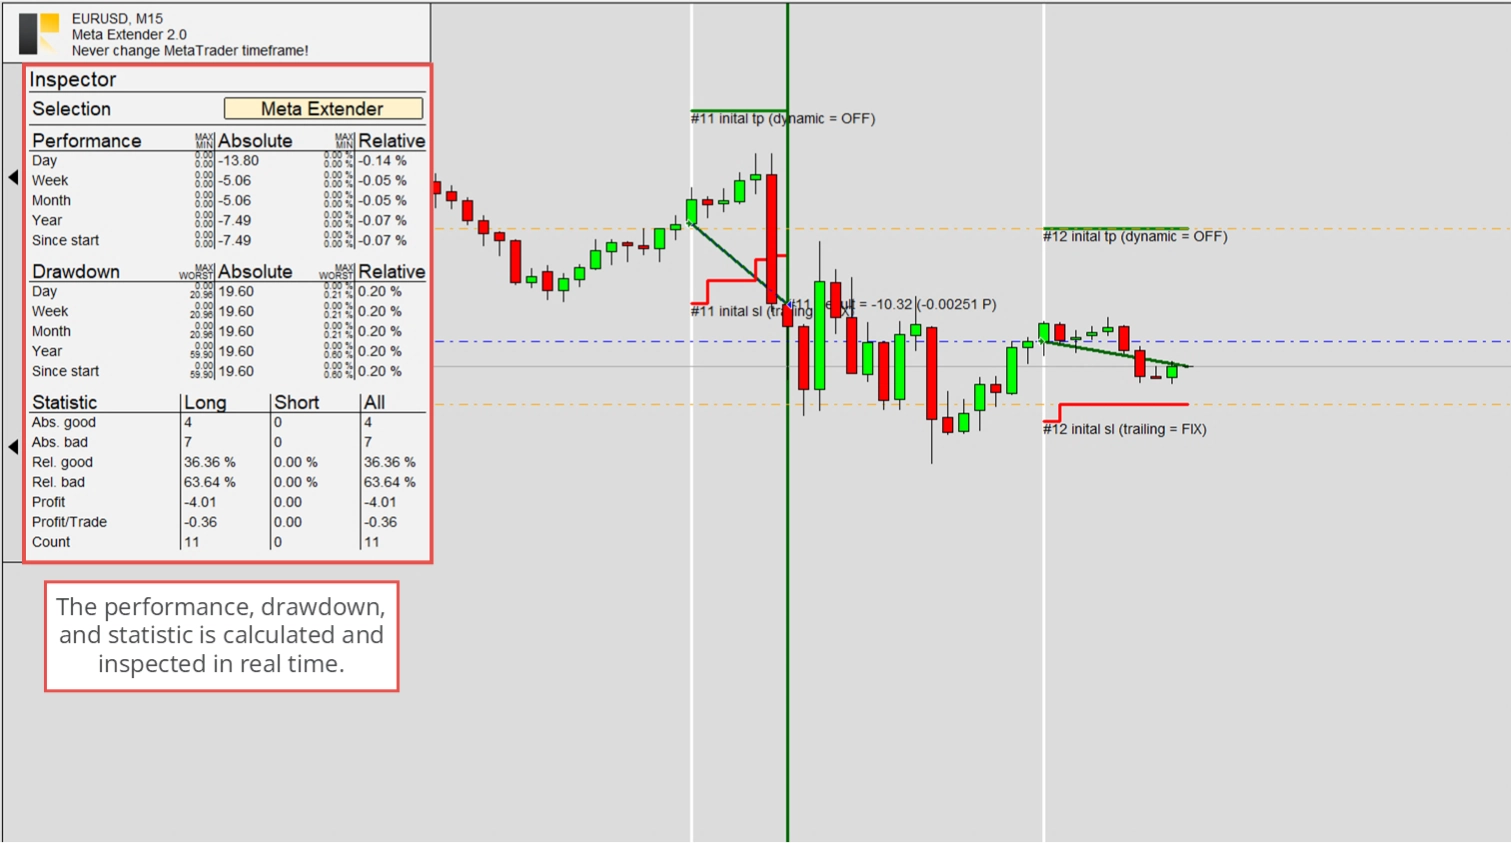
You'll find a performance section, a drawdown section, and a statistics section with corresponding values for different periods. Each value is available as absolute and relative results - the time period-based values reset at the beginning of the next period. For instance, daily results reset every day at midnight; weekly results reset on the night from Saturday to Sunday; and so on.
While this serves an informative purpose, it can also block trading when a specific performance or drawdown limit, whether bad or good, is reached. The inputs section explains all the input parameters for this widget that can be configured at the start of the application. Please refer to this article to understand how the protection feature works.
Active Trades
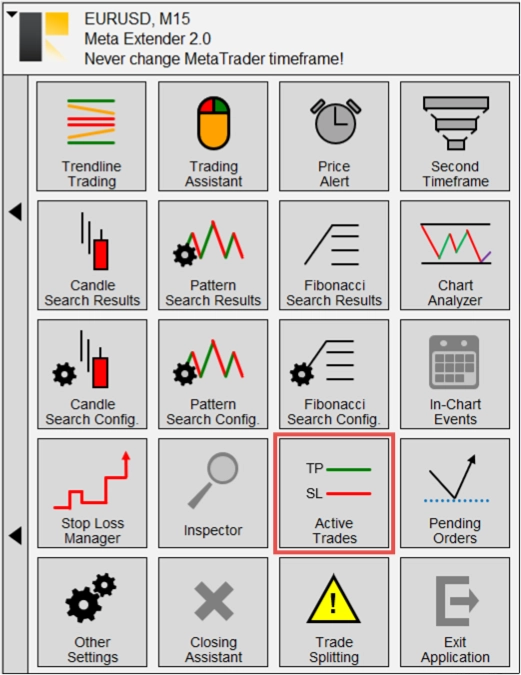
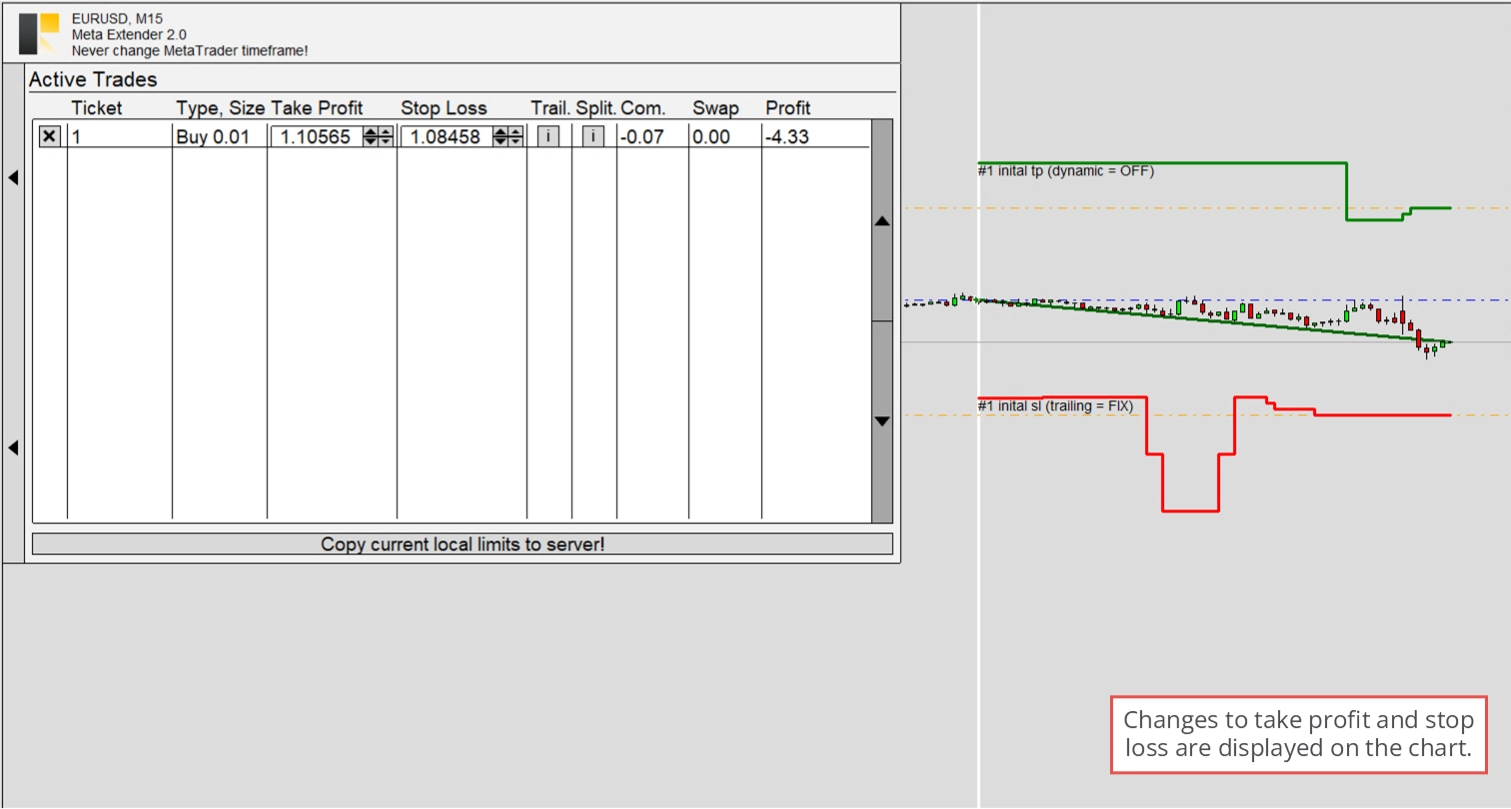
The Active Trades widget provides a table listing all currently open trades. This table includes all the information shown in the MetaTrader's Trade tab. It also allows you to change each trade's stop loss trailing method individually and reconfigure the trade splitting settings. To open the active trades table, navigate to Active Trades from your Meta Extender home screen.
In this table, you can close and modify each trade individually. The image below shows that the stop loss and take profit lines are updated according to their values. This helps you understand how to stop loss trailing work or how you adjusted the limit values yourself. The Meta Extender offers the ability to maintain the stop loss and take profit values locally instead of sending each modification to your broker's server. If this feature is enabled, the MetaTrader's tab view won't show any stop loss and take profit, but the Active Trades table would.
Use the info buttons to open each trade's Stop Loss Manager settings or Trade Splitting configuration.
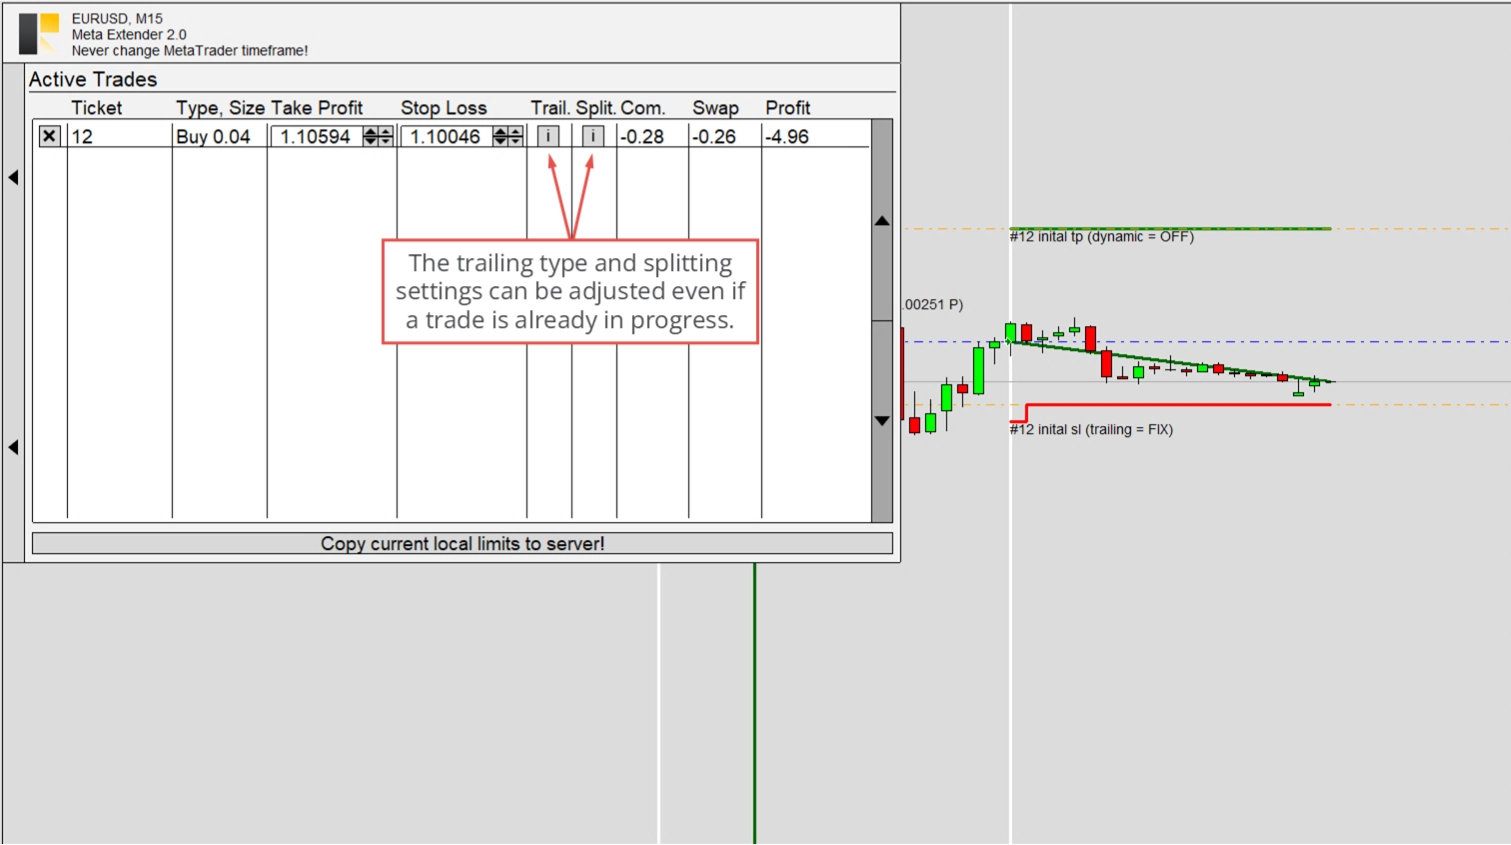
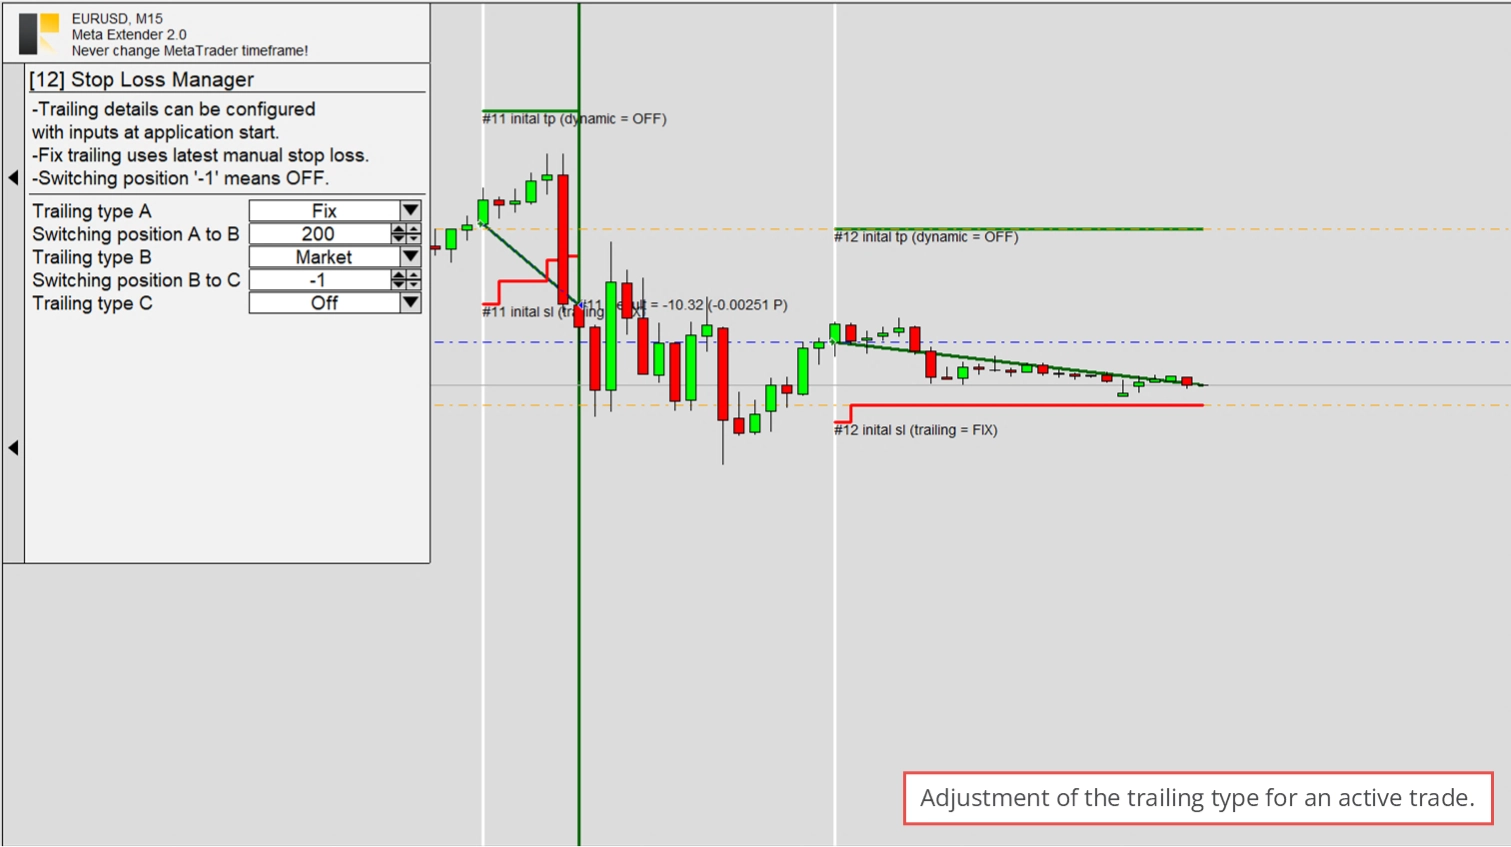
The info button for adjusting the trailing option opens a window that looks like the Stop Loss Manager. With it, you can readjust according to your needs. Each trade maintains its independent stop loss trailing settings.
The second info button opens the Trade Splitting configuration. This widget is explained later in this article. Generally, it looks the same as the actual widget.
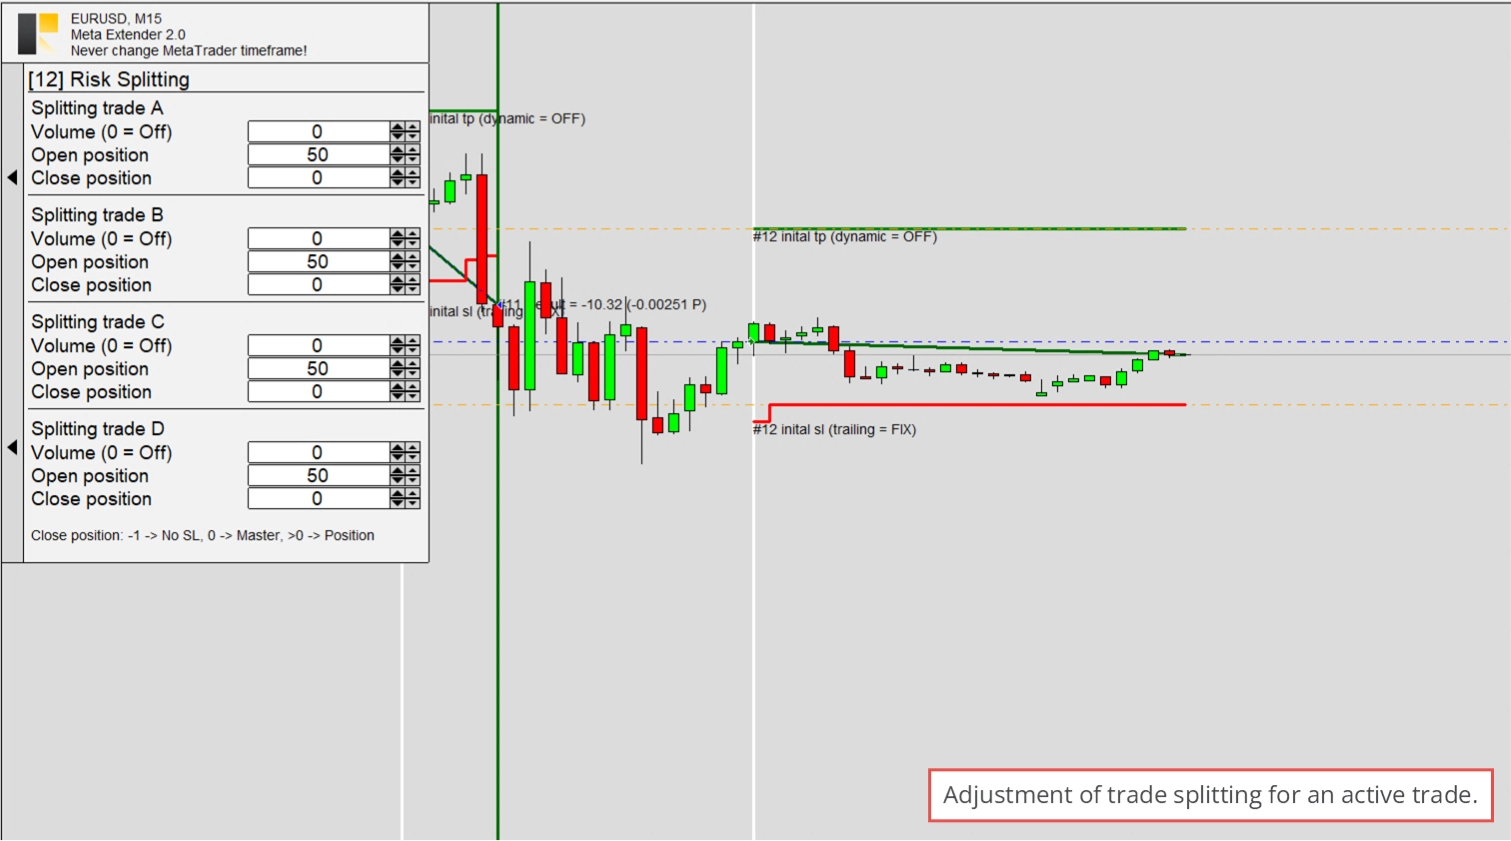
Both info windows can be interpreted as a snapshot of when the trade was opened. Please note that the active trades do not list any pending orders.
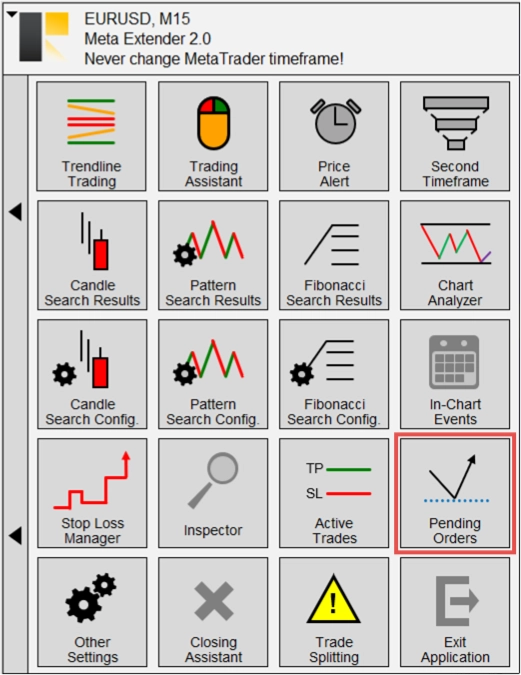
Pending Orders
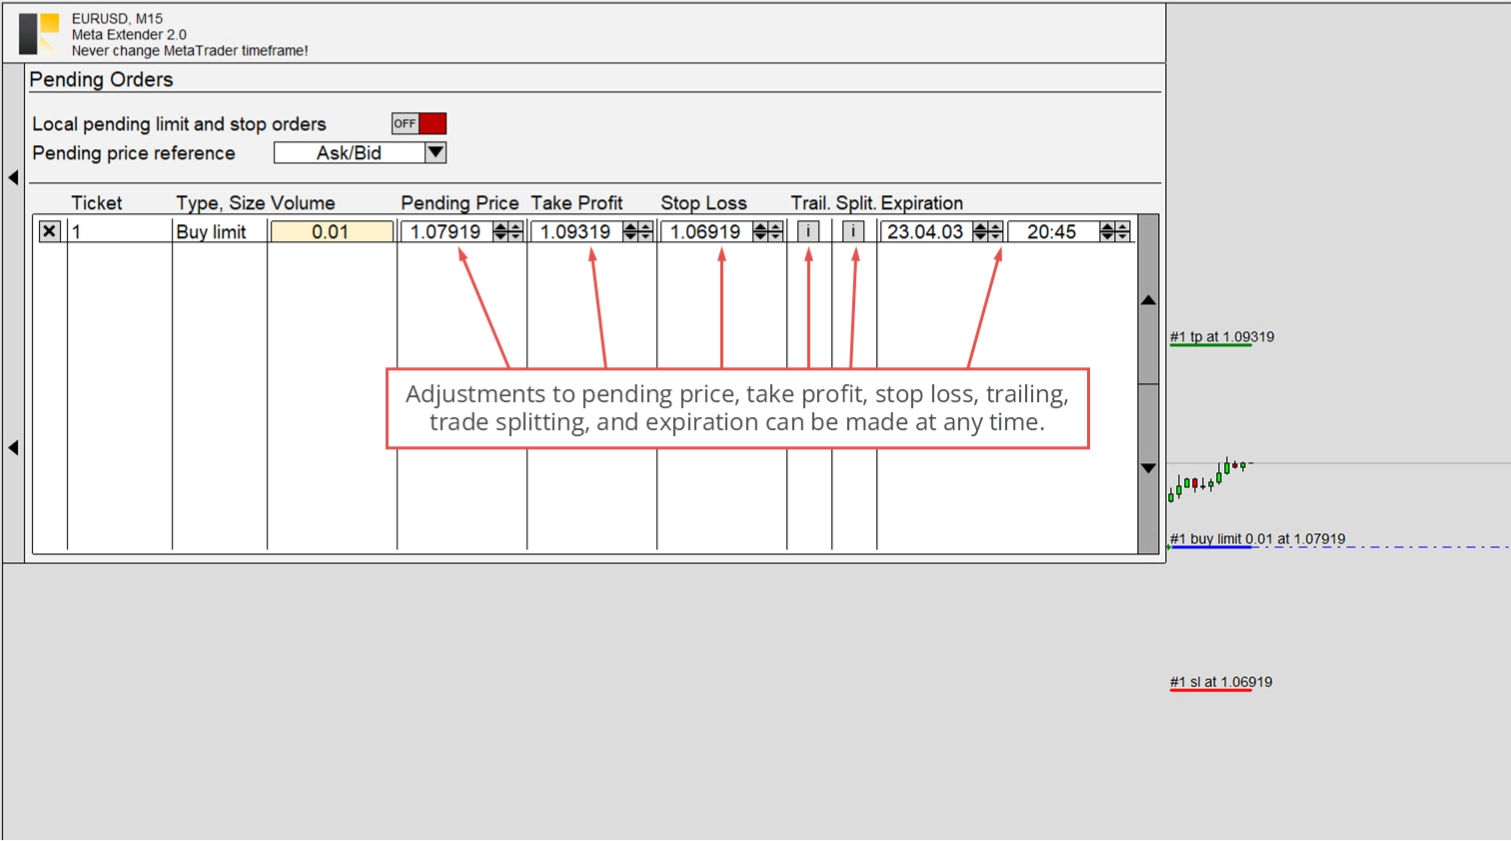
Pending orders, such as limit and stop orders, are listed in a separate table. You can access it by opening the Pending Orders widget from your home screen.
The functionality is similar to the active trades table, except that the pending price and expiration date can also be modified. Limit orders often have a significant impact on the process of price generation. In most cases, this might not affect your trading. But you can enable the local pending feature if you want to use a stealth mode. If Local pending limit and stop orders are enabled, the actual pending order will not be sent to your broker's server, nor will it appear in the MetaTrader's Trade view. Instead, the information about the pending order is managed locally. Then, a regular sell or buy market order is executed when the pending price is reached according to the order type.
This feature also enables the possibility of changing the pending price reference. For example, a buy stop order usually uses the asking price to trigger a trade; with the local pending orders feature, you can use other prices, like the middle value between the bid and ask instead. This is particularly useful for reacting to higher spreads in very volatile markets. Usually, a broker widens the spread, thus increasing the ask and lowering the bid price; this might not reflect the actual price movement since your broker's spread characteristic influences it. This setting helps with faster trading styles like scalping and day trading.
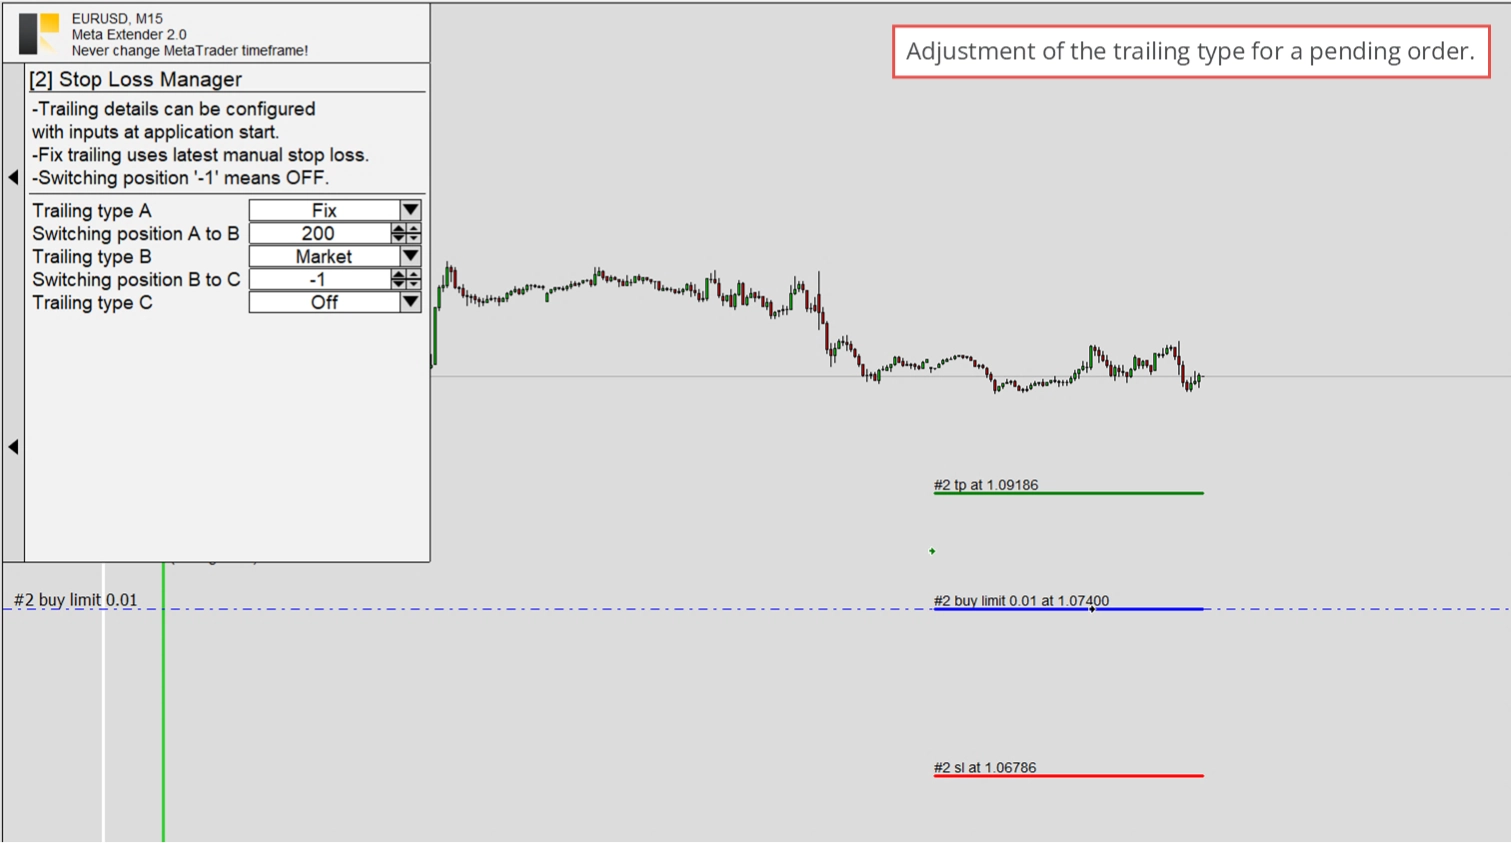
As mentioned, the Stop Loss Manager info screen looks the same as the widgets.
The same is true for the Trade Splitting info window.
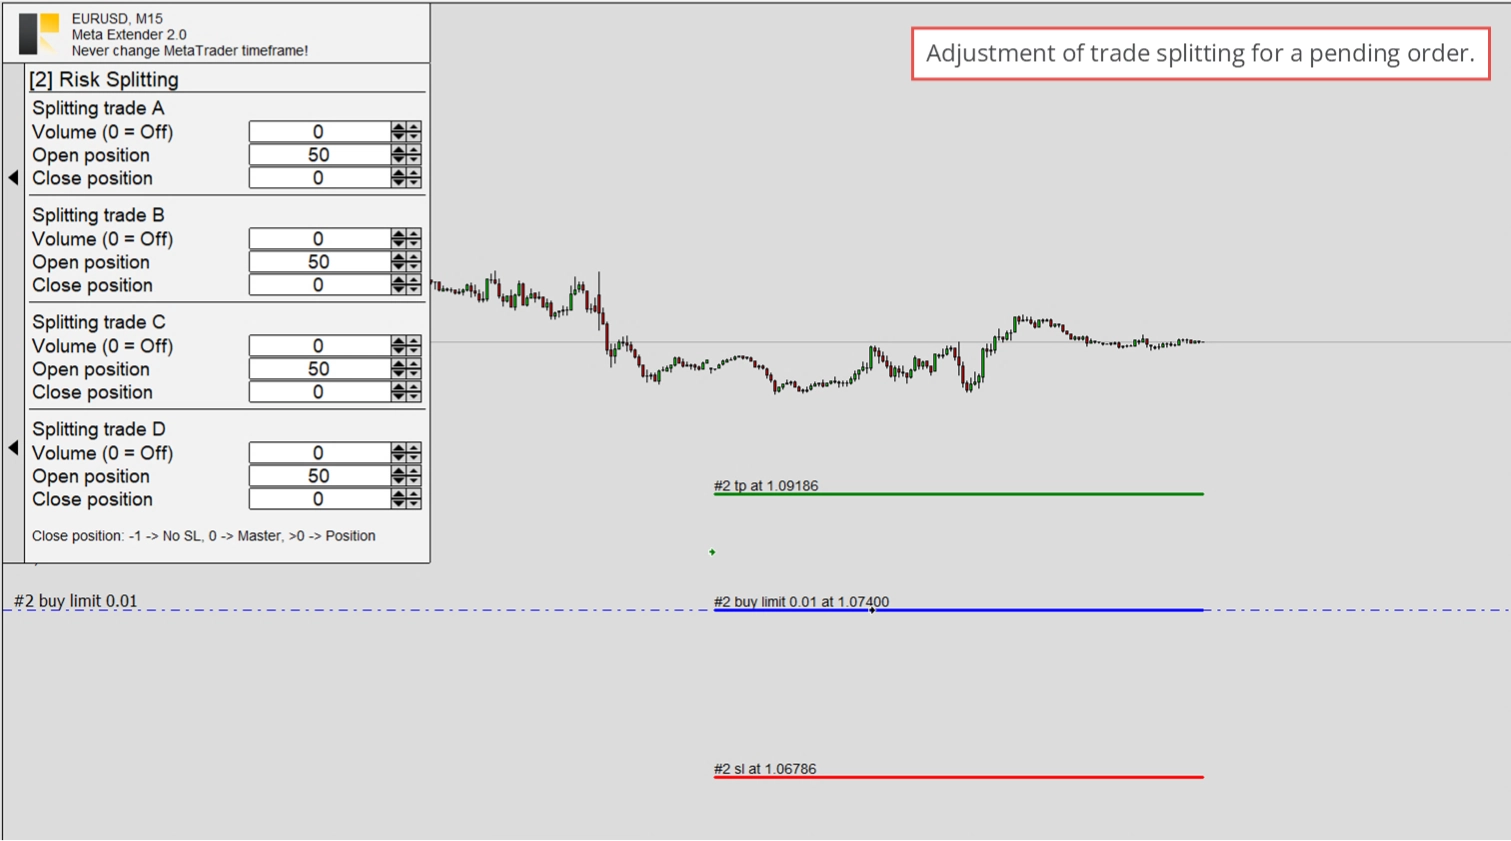
In both cases, the configuration is managed independently from other pending orders.
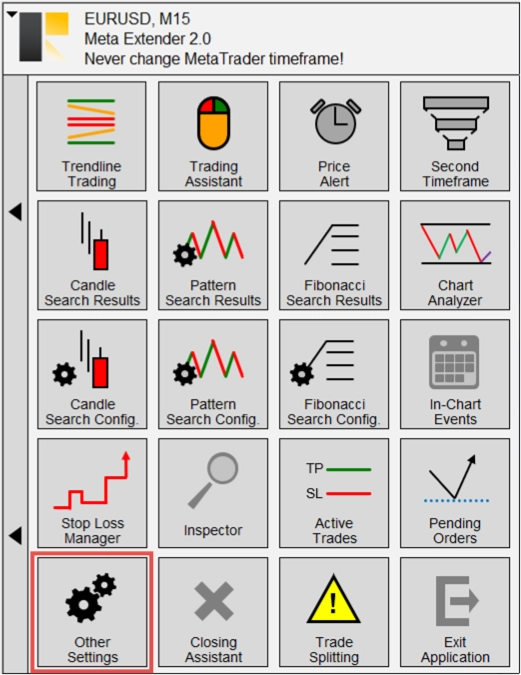
Other Setting
In the Other settings widget, you can find bulk settings to configure your notification preference and enable further features.
The Meta Extender can inform you about trade openings, trade closings, inspector events when a limit is reached, daily reports, found candles, chart or Fibonacci patterns, and price alerts. All notifications are, by default, only shown within the Meta Extender user interface. Additionally, you can configure to send the information via email or push notification on your mobile phone by enabling the features accordingly. Please refer to this article to inform yourself how to allow email and mobile notifications with your MetaTrader.
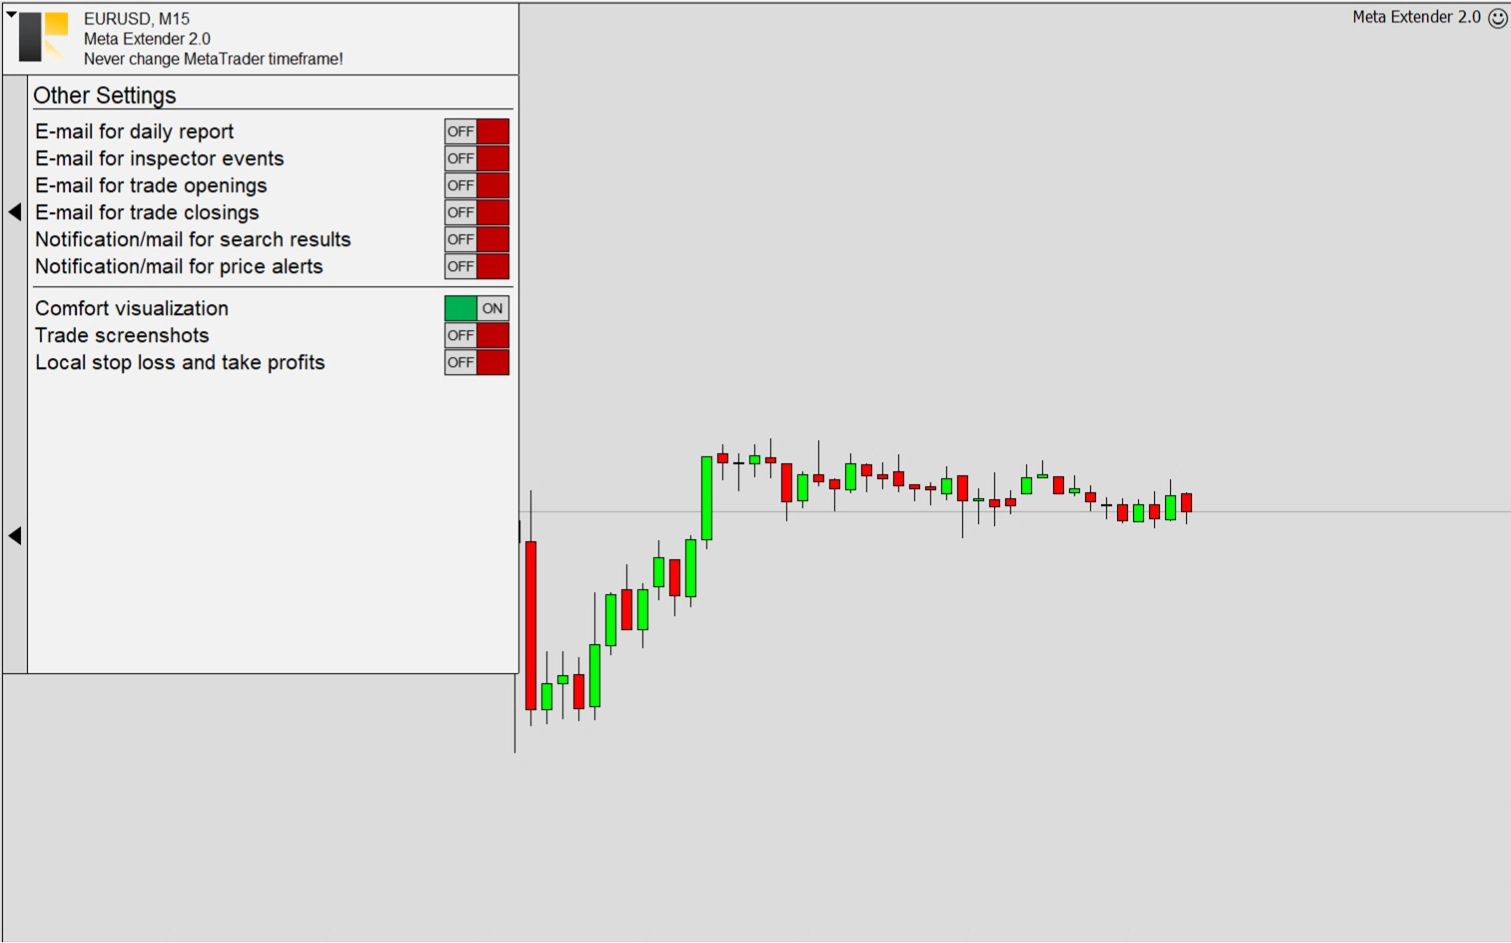
Additional settings are the following:
- Comfort visualization: As already shown, the Meta Extender displays a trade differently than the standard Meta Extender. For example, you can see how the stop loss and take profit were modified when a trade was opened and closed. However, if you do not like this type of visualization, please feel free to turn it off with this switch.
- Trade screenshots: If enabled, the Meta Extender saves a screenshot whenever you open and close a trade. This is useful to analyze performed trades in the aftermath analysis. The screenshots will be kept in an output folder.
- Local stop loss and take profit: Instead of sending the stop loss and take profit information to your broker, you can let the Meta Extender manage these values locally. Some brokers purposely use the stop loss information to insert peaks into their price charts to distract customers. By using local limits, you can make it hard for your broker to use your stop loss as a reference to adjust the price. Please take into account that this practice is only performed by unserious brokers. If you ever experience this, it's recommended that you change your broker.
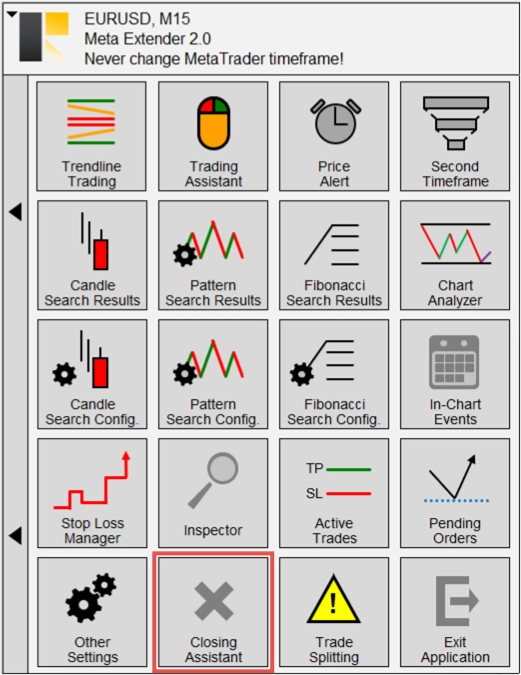
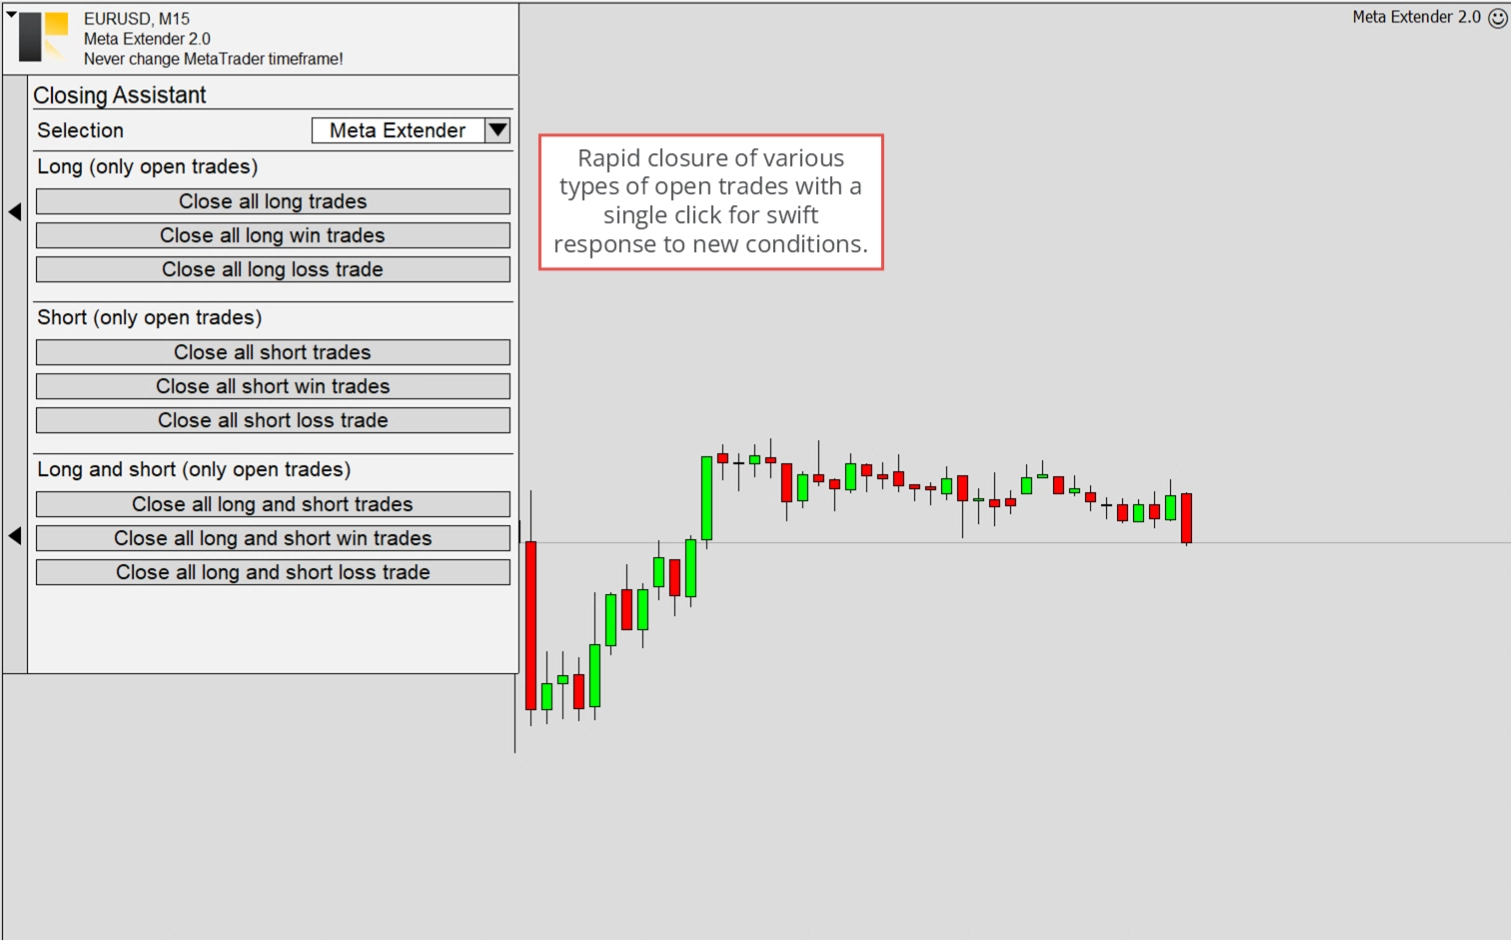
Closing Assistant
On your home screen, you'll find a widget named Closing Assistant. This widget allows you to close multiple trades simultaneously.
The widget has a single input parameter: the selection of trades to be closed. You can select one of the following options:
- Meta Extender: This option configures the widget to close only the trades opened with the Meta Extender.
- Symbol: This option configures the widget to close only the trades opened in the symbol on which the Meta Extender is currently applied.
- MetaTrader: This option configures the widget to close all trades that match the closing button description and are managed by your MetaTrader.
Remember that when Symbol or MetaTrader is selected, the Meta Extender also closes trades eventually opened by other applications.
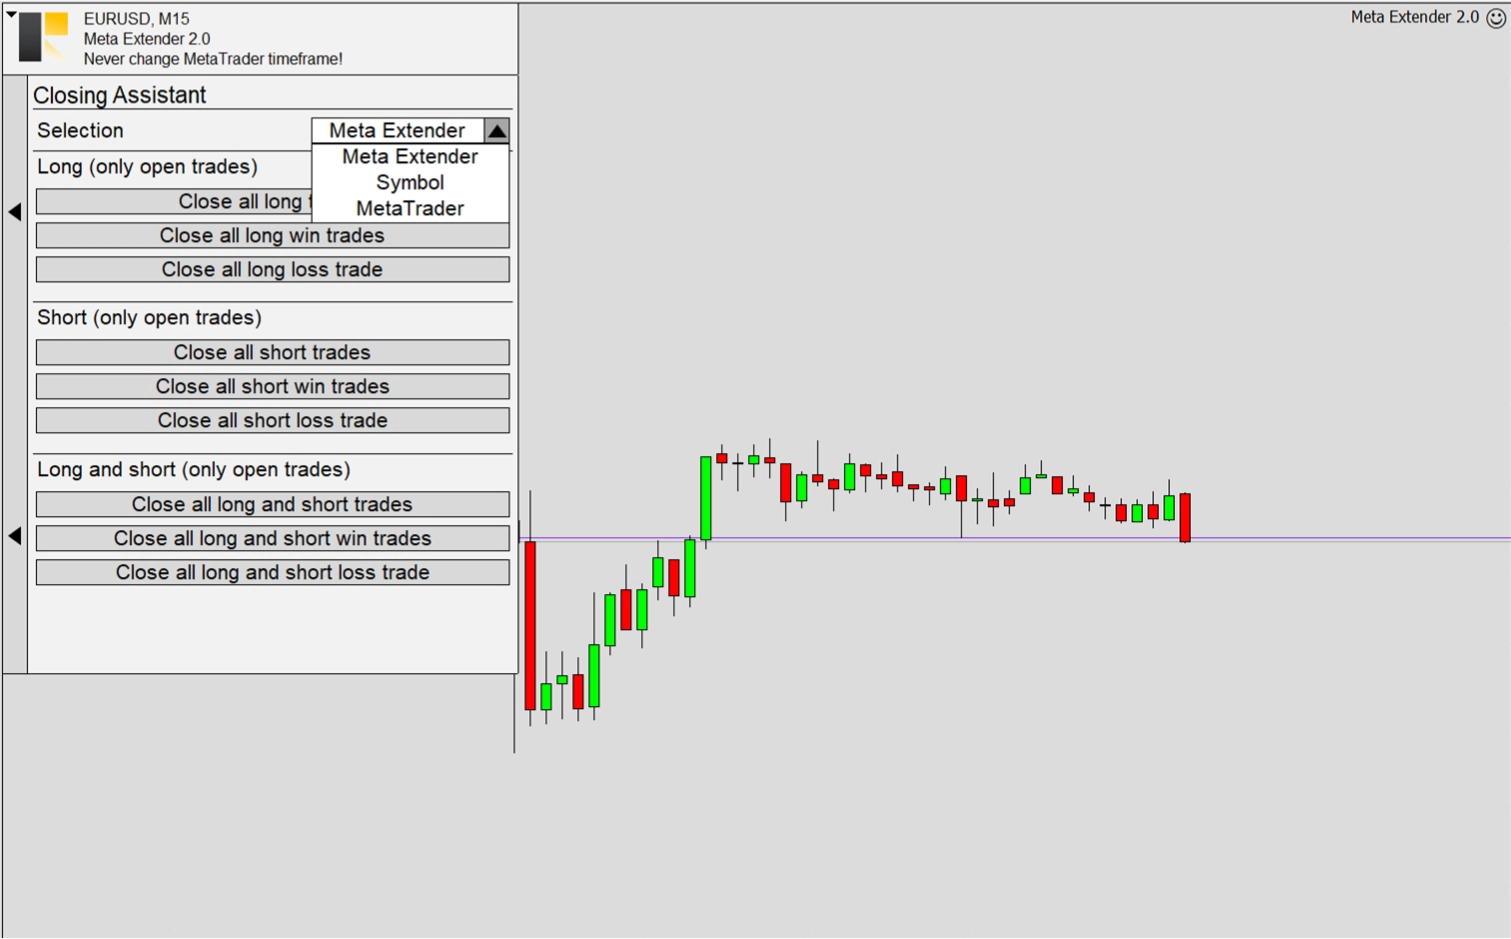
As shown in the widget view, you can use these options to close multiple trades with a single click. This feature is handy in fast-paced market conditions, allowing you to complete winning or losing trades.
Please note that the Meta Extender will automatically close the trades meeting the closing criteria without further approval.
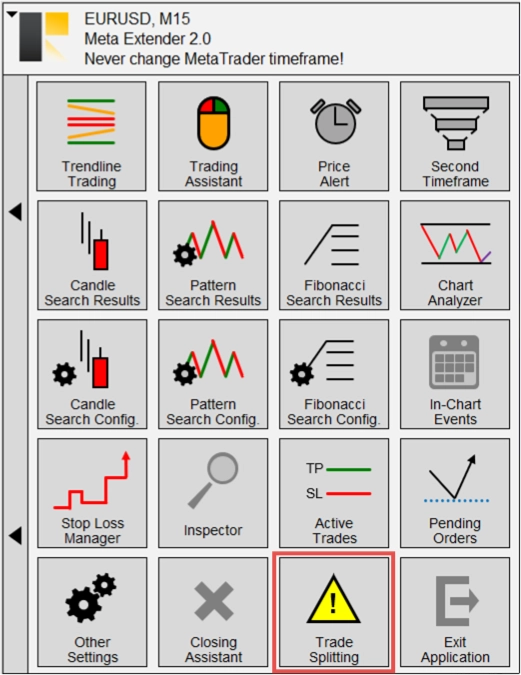
Trade Splitting
Trade splitting is a strategy in trading where a single trade is divided into several smaller trades. This approach is often used to manage risk and enhance trade execution. For example, a trader may split a trade into two or more parts instead of investing the entire amount. Each part is then executed separately. This can be done in any ratio, such as 50:50, 30:70, 50:30:20, 30:30:20:20 or other ratios. A tactic like that allows traders to maximize their profits and minimize losses by adjusting based on the market's response to the initial trade. It's a flexible strategy that can be particularly beneficial in volatile markets.The Trade Splitting widget, accessible from your home screen, allows you to split your trade into up to four sub-trades. Each sub-trade can have different trade entry and exit points, with the first trade used as a reference, the so-called master trade. The first trade (master) is the one you configure with the Trading Assistant or Trendline Trading widget. When any trade is opened, the Trade Splitting settings automatically apply.
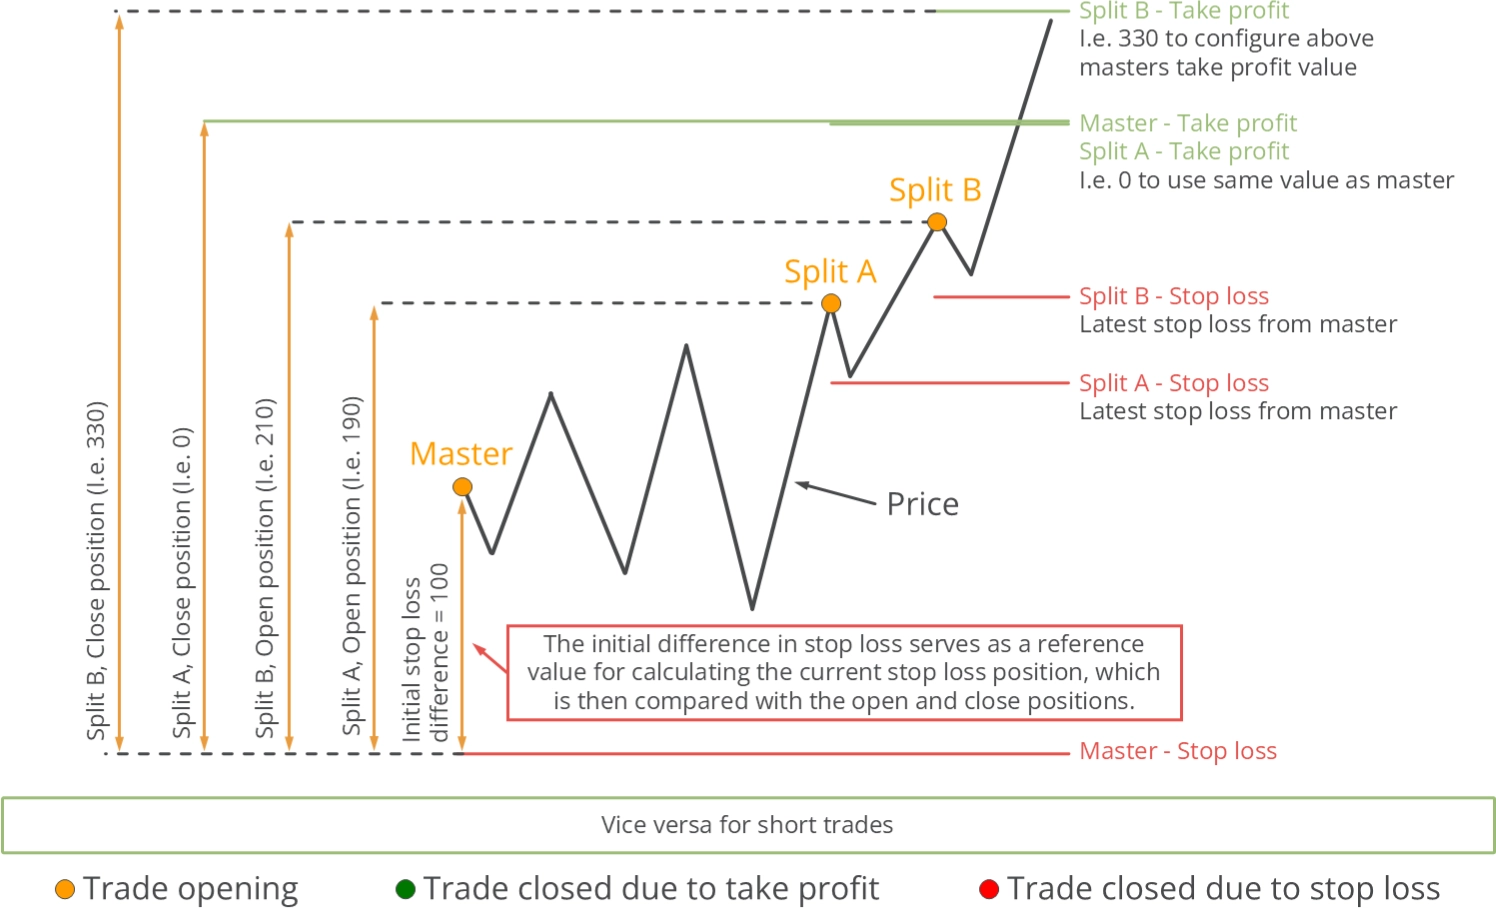
The functionality of the Trade Splitting widget is illustrated below.
As with the Stop Loss Manager, the initial stop loss difference of the master trade serves as the reference for each split trade. It represents the unitless value of 100. Let's assume the initial stop loss difference is 100 pips. If the input parameter Splitting trade A - Open position is set to 190, the second trade will be opened when the price reaches the point: Master trade initial stop loss + 190 pips. Splitting trade B, configured with the open position 210, will then be opened at the master trade initial stop loss value + 210 pips. This relative price description is also used to define the take profit value, which will be used to close the trade. Please note that the stop loss will be reused from the master trade, even with the same trailing characteristic.
Based on this relative price position description, the minimum value of the open positions can be 0, and the take profit level of the master trade defines the maximum value. For the closing position, the same minimum and maximum values apply, except 0, which means the same take profit as the master trade will be used, and -1, which means no take profit is used.
A split trade is only active if the volume is unequal to zero but larger than 0. This input parameter is a percentage of the master trades' volume. For example, if the master trade is open with 1.20 lots then Splitting trade B - Volume = 50 means a trade with 0.60 lots in volume size will be opened when Splitting trade B - Open position is reached. A split trade is disabled when the volume configuration equals 0.
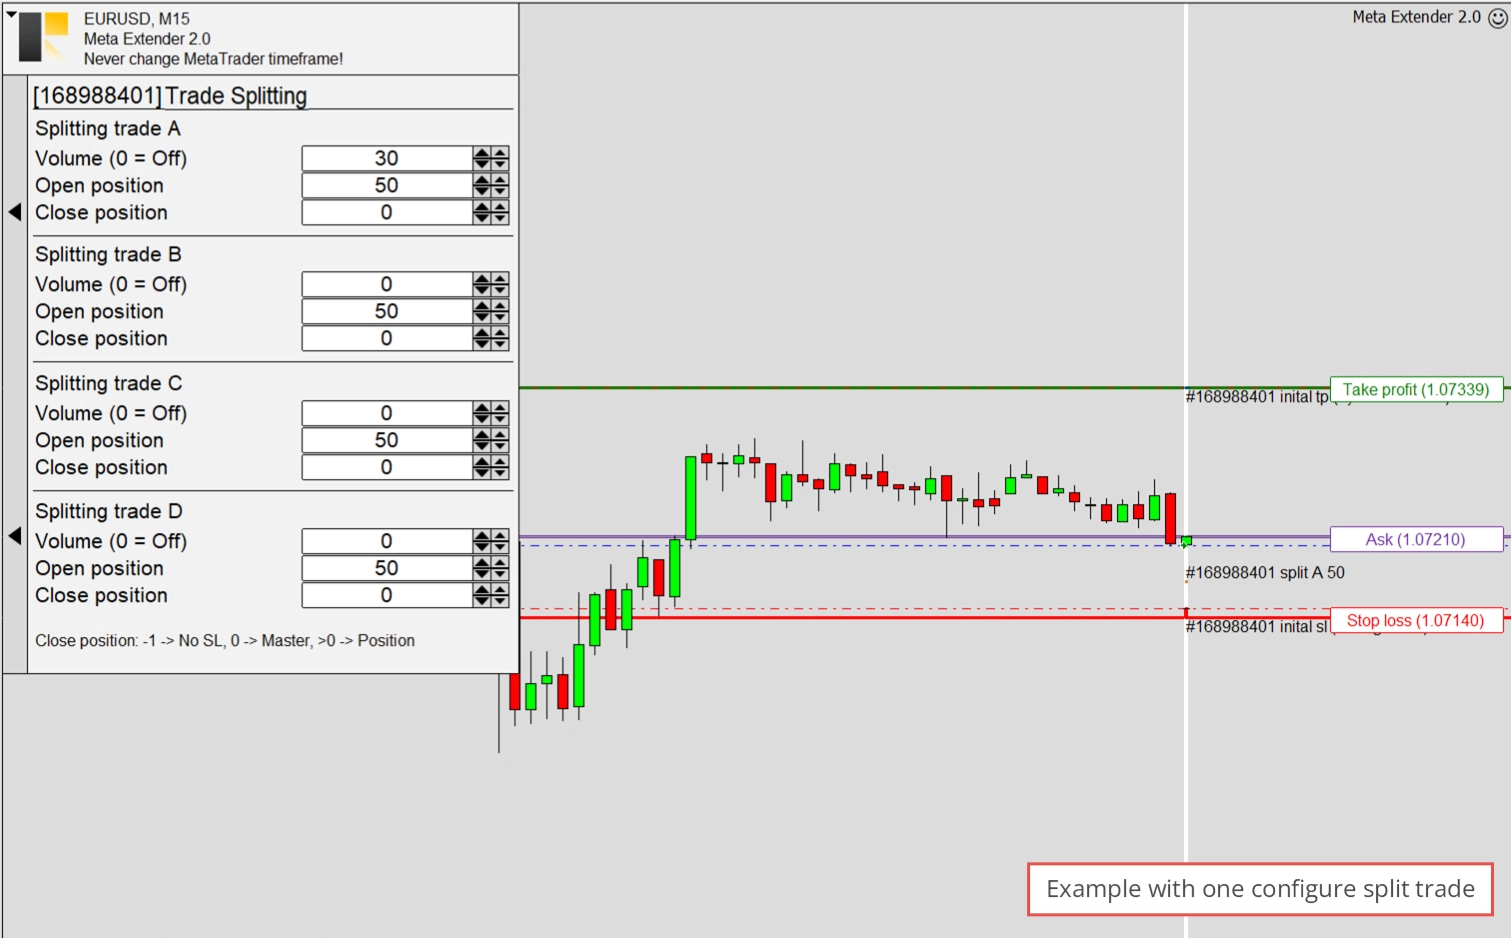
The following illustration demonstrates a trade splitting configuration with one configured split trade. The open position (Splitting trade A) is set to 50, which implies that the master trade must fall halfway to the stop loss to trigger the split trade. This feature can repurchase the same asset when its price decreases, increasing the volume held.
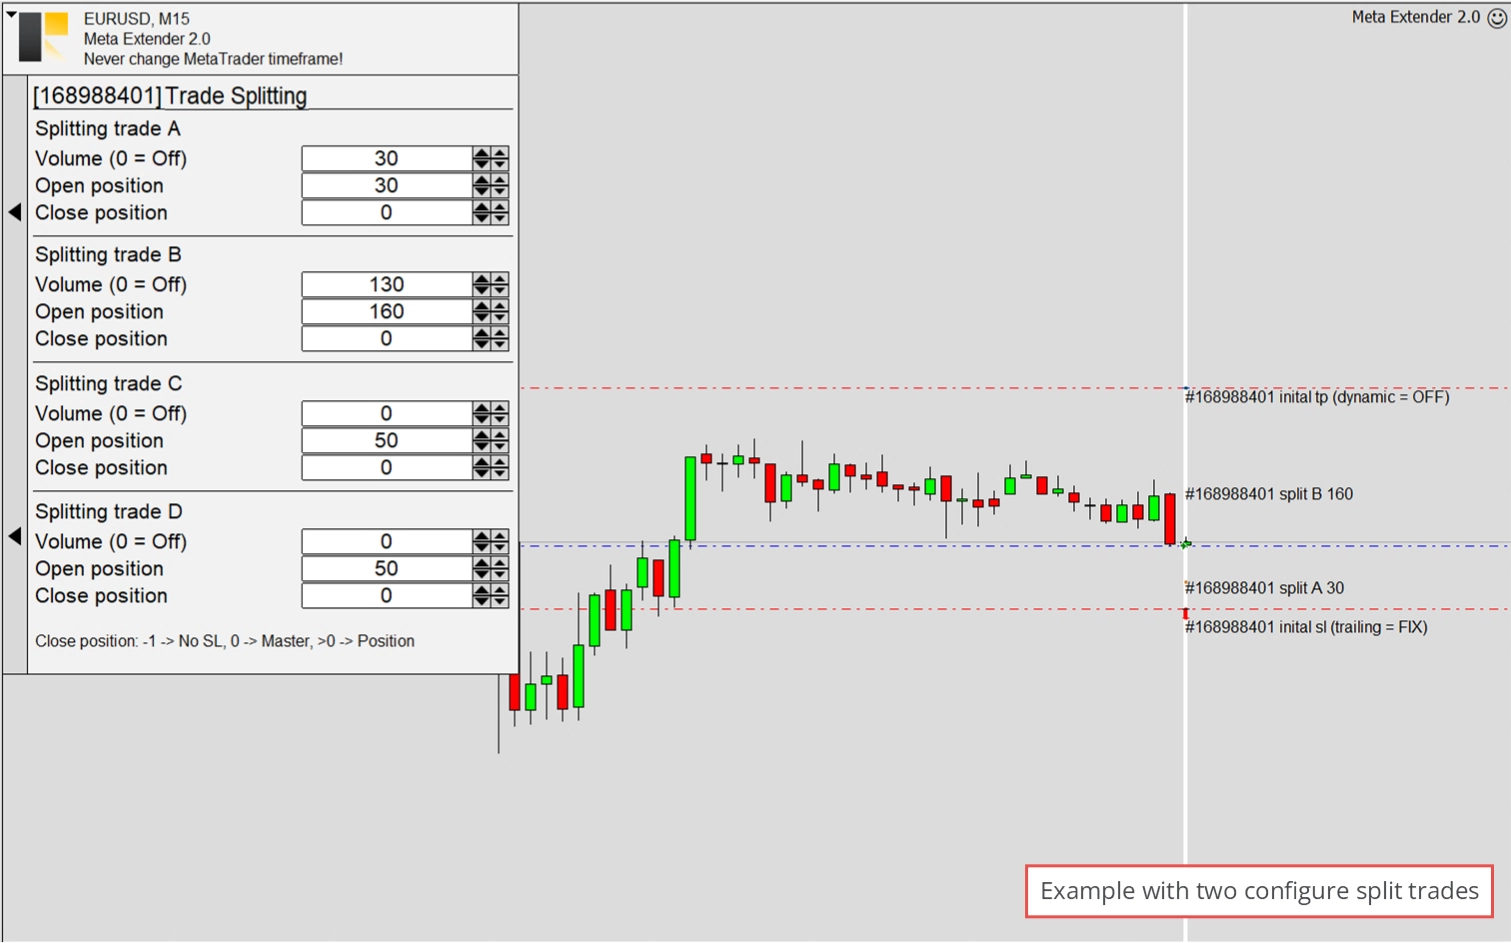
In the following image, you will see two split trades. Splitting trade A - Open position is set to 30, which means it will be executed when the price falls below the opening price and is close to the stop loss. Splitting trade B will be opened when the price increases above the opening price and crosses the Splitting trade B - Open position, configured to 160. The open position is also displayed in the chart itself.
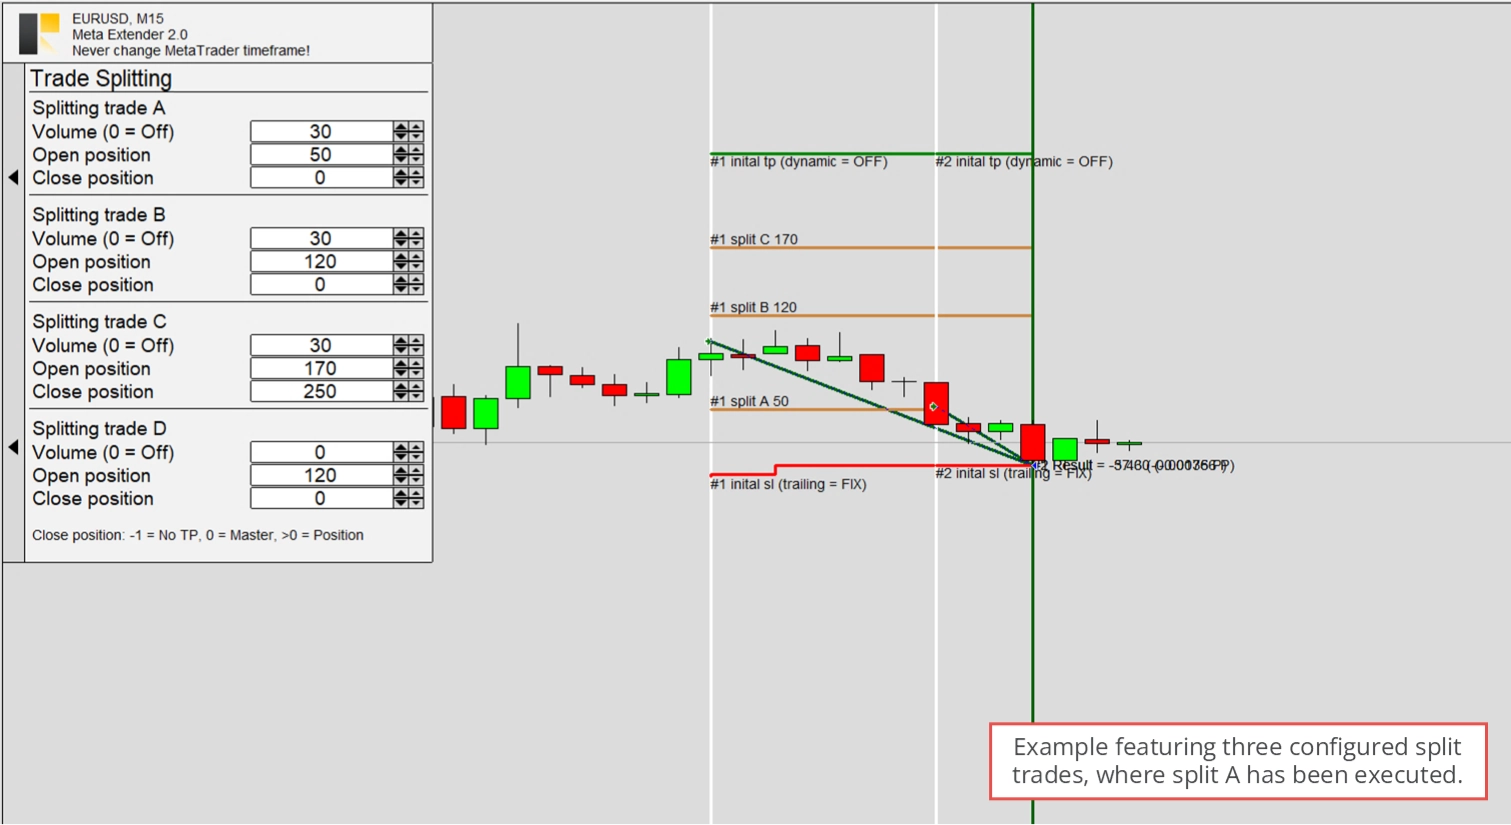
The last example illustrates a master trade configured with three split trades, but only one was triggered when the price decreased. Open positions are 50 (A), 120 (B), and 170 (C). The stop loss trailing method was taken from the master trade, and as you can see, the initial stop loss of Splitting trade A represents the stop loss value the master trade had when Splitting trade A was initiated. In this scenario, both trades were stopped out.
In essence, this widget offers a variety of trade-splitting strategies to mitigate risk and adapt to specific market conditions.
Exit Application
The final widget yet to be discussed is the Exit Application widget.
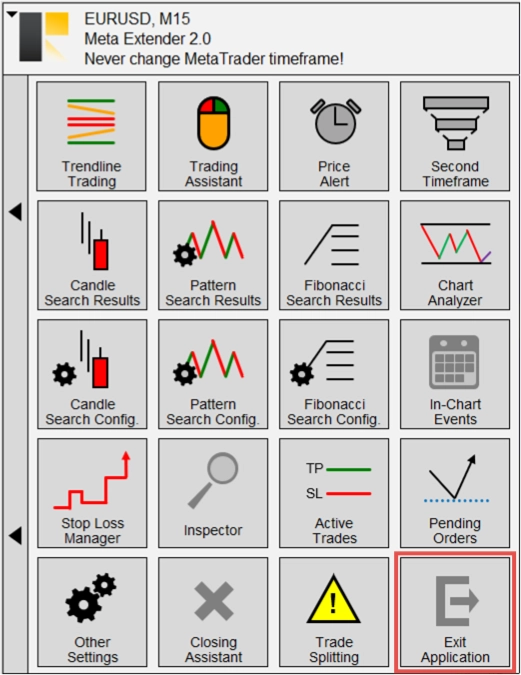
This widget allows you to close the Meta Extender. However, it's worth noting that you can also exit the Meta Extender using the standard option MetaTrader provides to remove expert advisors.
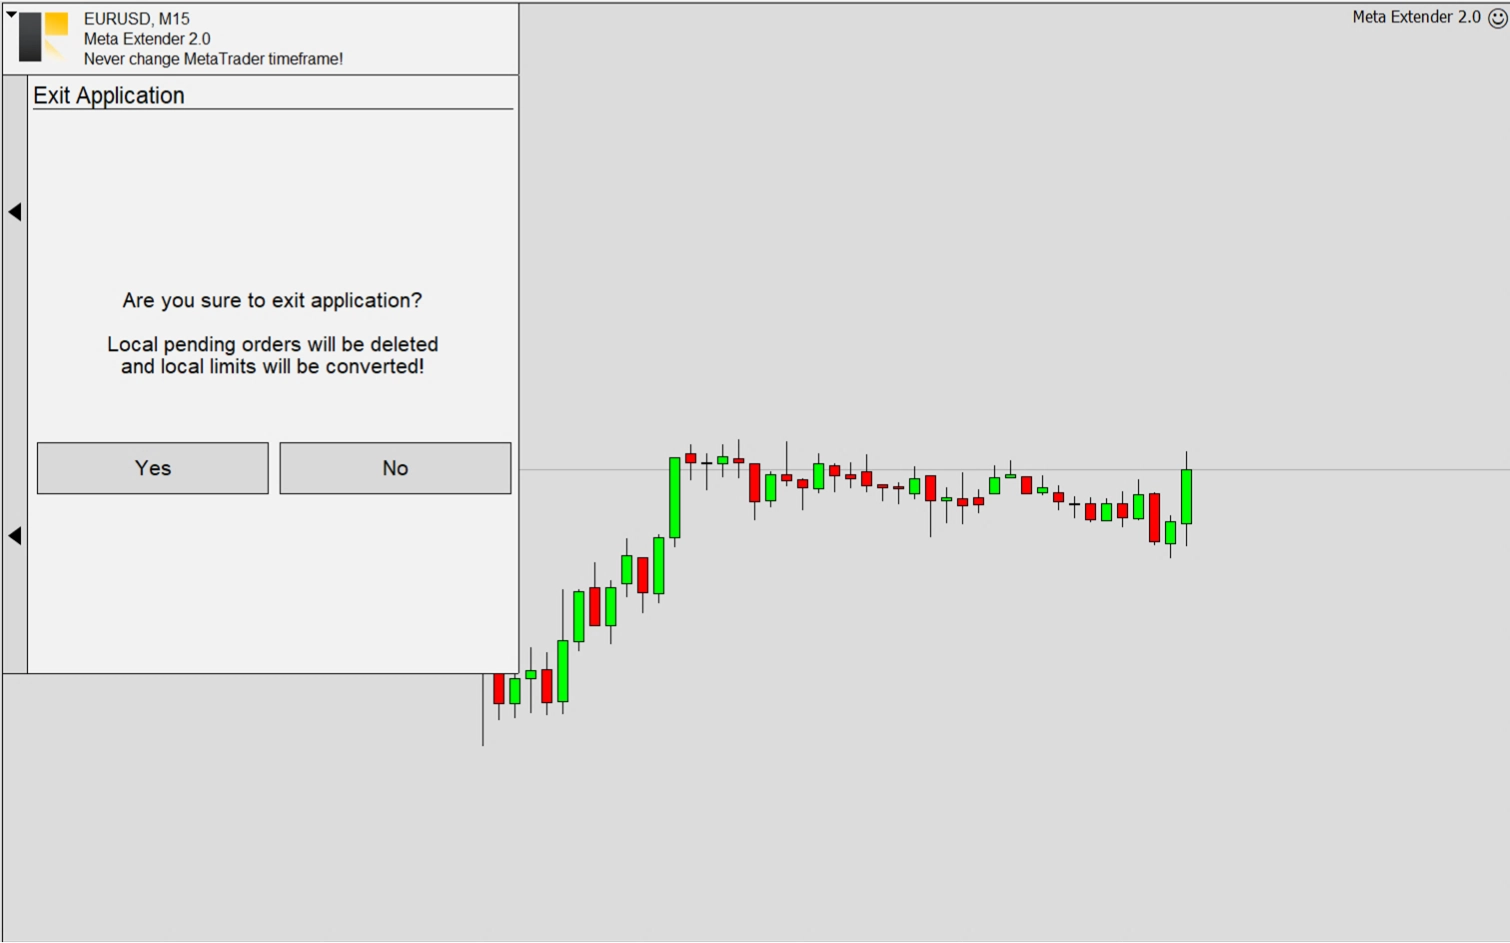
When the application is deactivated, any locally managed pending order will be deleted, and all locally managed stop loss and take profit orders will automatically be converted to server limits. As a result, your trades will continue to be protected, albeit without the sophisticated stop loss management.