Trading in a Nutshell
Note
Given that trading can be an overwhelmingly complex topic for beginners, this article aims to introduce the most crucial concepts. While this article does not purport to be a comprehensive glossary for trading or claim to explain the absolute reality of trading, it can benefit beginners seeking a better understanding of the offered products. Moreover, even experienced or professional traders might find this concise summary enjoyable.
History
Trading has been a fundamental part of human societies for centuries. The invention of money greatly simplified and promoted trade. Trade exists due to specialization and the division of labor, where individuals and groups concentrate on a small aspect of production but use their output in exchange for other products and needs. Different regions may have a comparative advantage in producing some tradeable commodity.
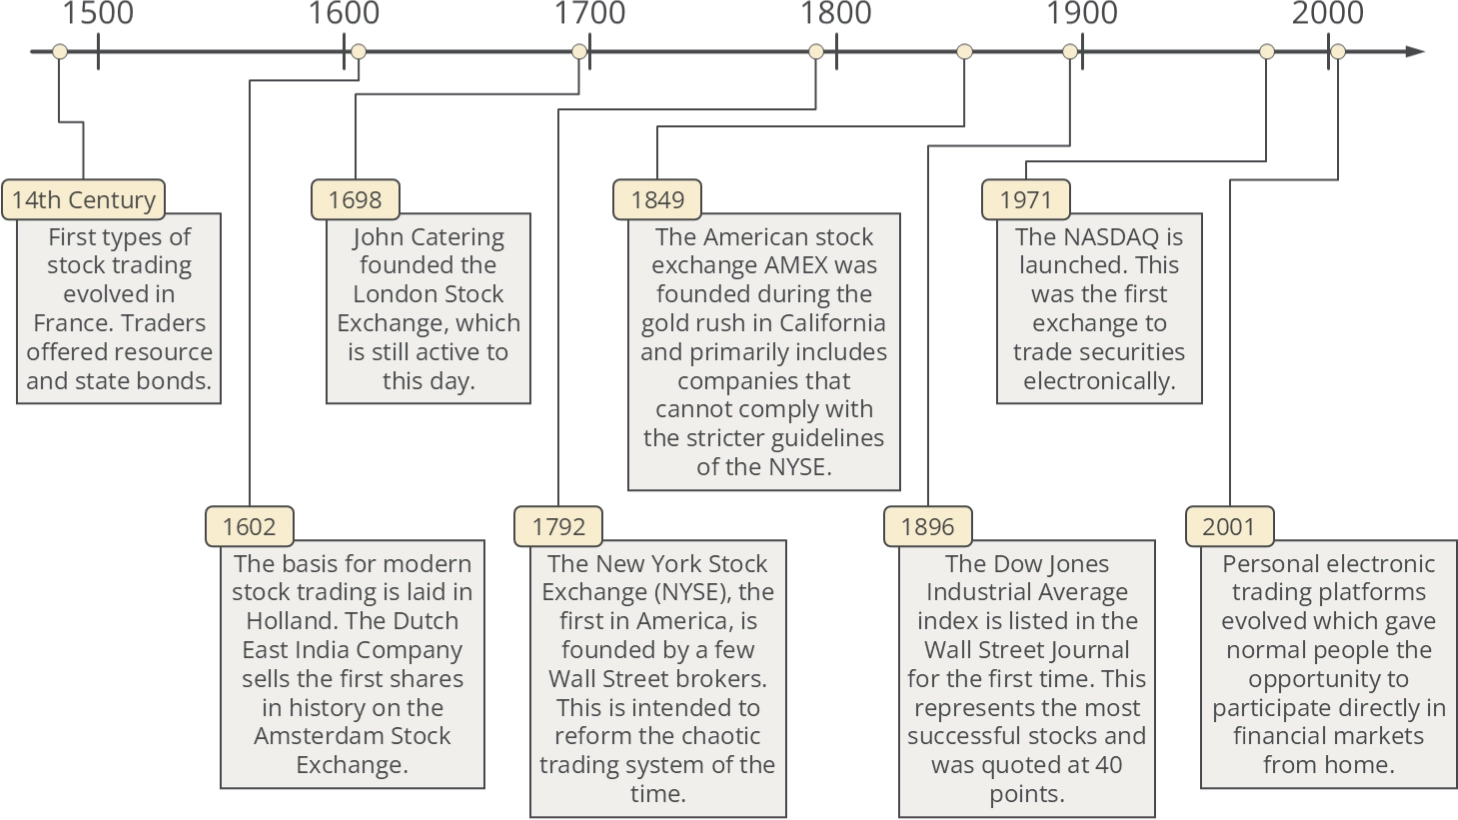
Openness to free trade substantially increased from 1815 until World War I in 1914. Trade openness increased again during the 1920s but collapsed during the Great Depression of the 1930s. It grew substantially again from the 1950s onward.
Electronic trading dates back to the 1970s (Introduction of the NASDAQ). However, significant development occurred during the 1990s and 2000s with the spread of the Internet and trading platforms for personal use. Electronic trading slowly replaced traditional floor trading and telephone trading over the following 20 years.
Recommended external content:
Trading vs. investing
Trading and investing are two distinct methods of attempting to profit in financial markets. Both investors and traders seek profits through market participation. However, they achieve this end in different ways. Trading involves more frequent transactions, such as the buying and selling stocks, commodities, currency pairs, or other instruments. The goal is to generate returns that outperform buy-and-hold investing. Traders take advantage of rising and falling markets, entering and exiting positions over a shorter timeframe. This can involve careful analysis of market trends and patterns and typically requires a more significant time commitment.
Investing, on the other hand, is a longer-term approach. It involves buying and holding assets for an extended period, often years or decades. Investors often rely on fundamental analysis, which includes evaluating a company's financials, an industry's outlook, or economic conditions more broadly. The goal is to gradually build wealth over an extended period by buying and holding a portfolio of stocks, bonds, mutual funds, or other investment instruments. While both methods aim for profits, they require different skill sets and involve various risks and rewards.
Recommended external content:
Bid, ask, and spread
In financial markets, Bid, Ask, and Spread are critical terms used in trading.
A bid is the price at which a trader is willing to buy a good, for example, fresh fish. It represents the maximum price a buyer is ready to pay for the good.
Ask, also known as Offer, is the price a seller is willing to accept for the same good (fresh fish). It's the minimum price that a seller is ready to receive.
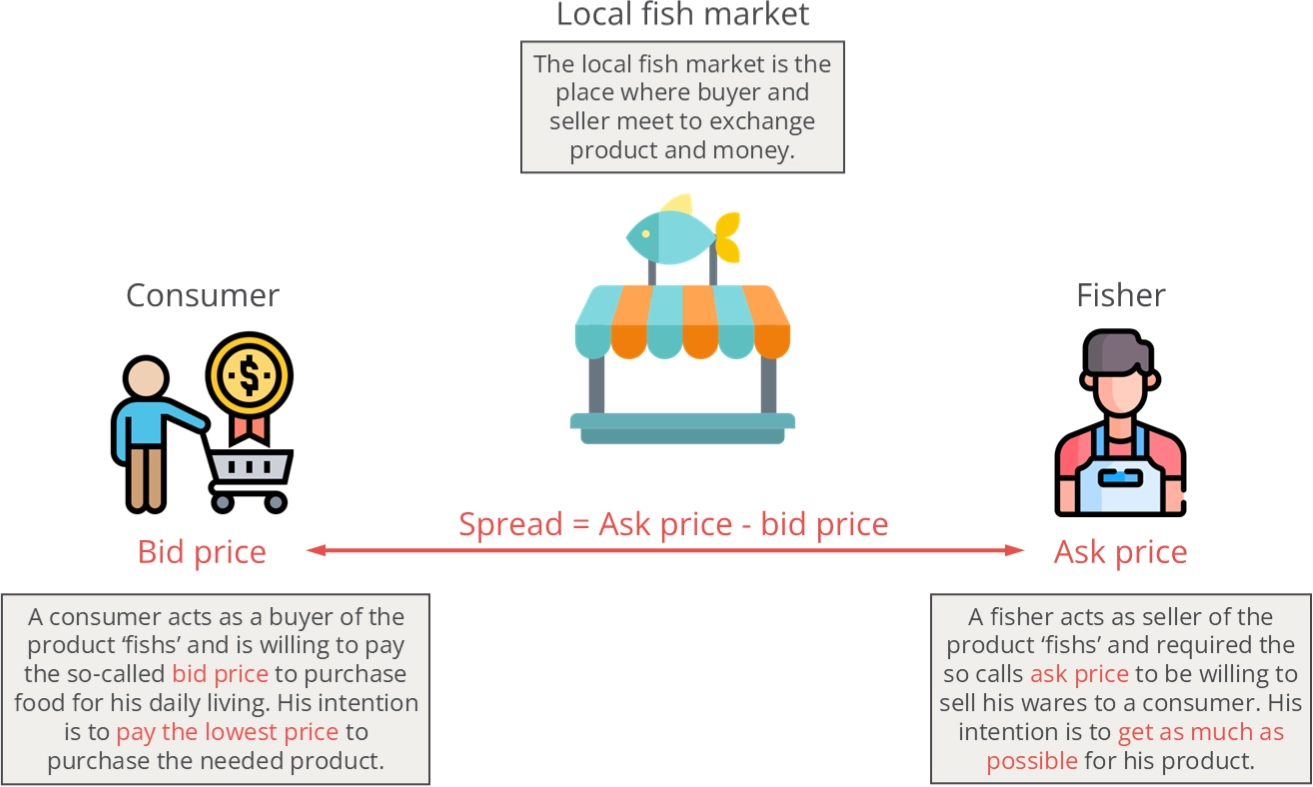
Spread is the difference between the bid and the ask price. It's the difference between the highest price a buyer is willing to pay for the good and the lowest price a seller is willing to accept. An individual looking to sell will receive the bid price, while one looking to buy will pay the ask price. The Spread often is how market operators (local fish markets) profit - the more comprehensive the Spread, the more profit for the market operator.
Grasping these terms is vital for anyone who trades any goods or services. In contemporary times, the exchanged goods could be, for instance, stocks or futures.
Recommended external content:
Contract for differences
A Contract for Differences (CFD) is a widely used form of derivative trading. It lets you speculate on the fluctuating prices of rapidly moving global financial markets, such as stocks, indices, commodities, currencies, and treasuries. This is akin to assuming in a traditional market, like fresh fish.
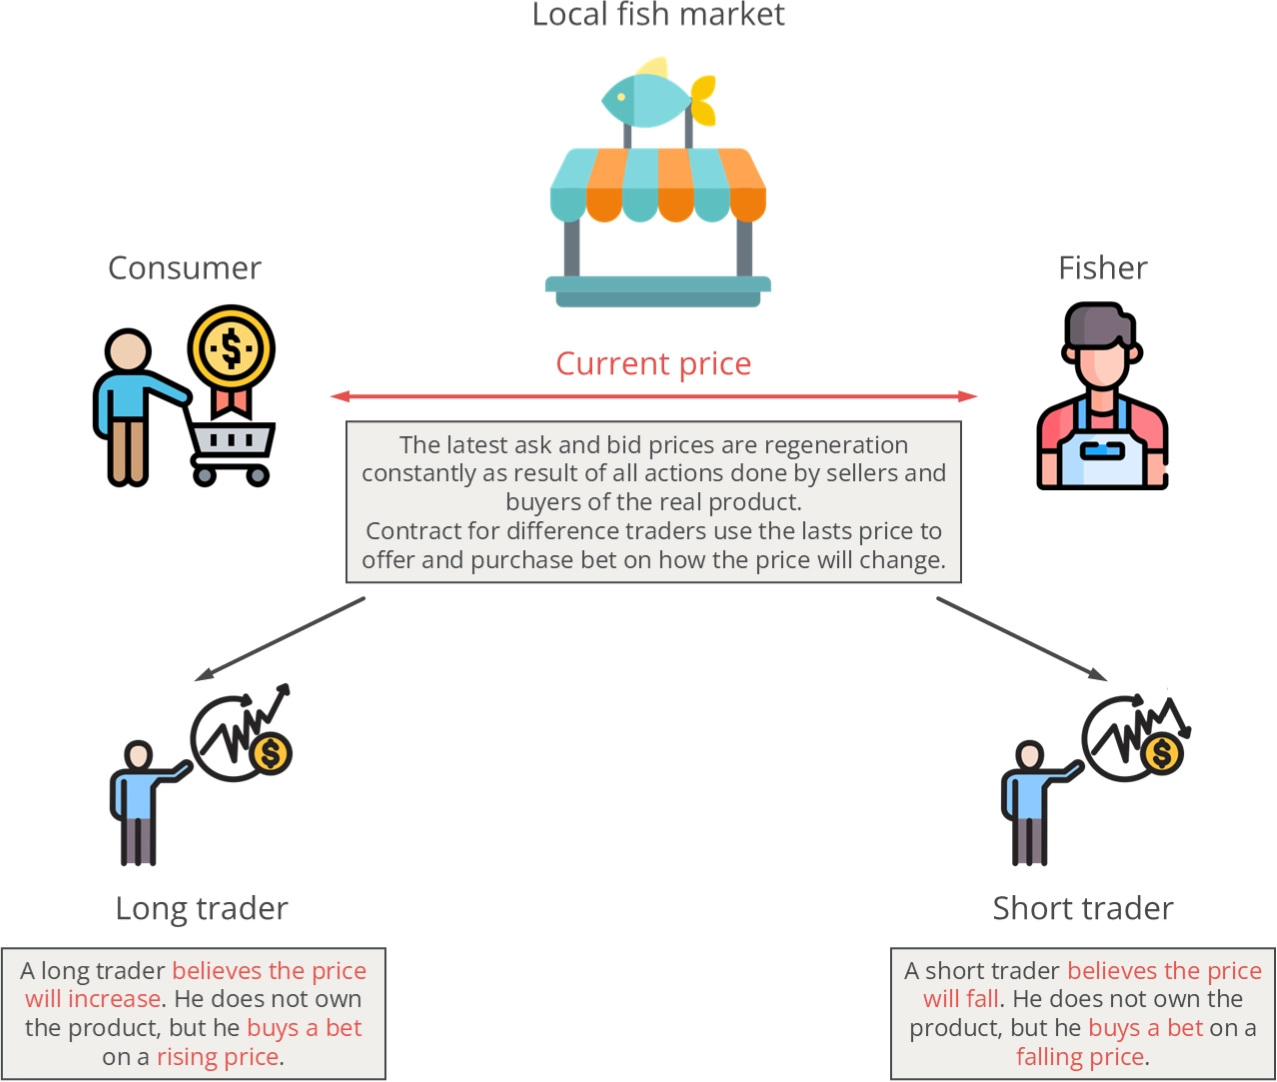
In a CFD contract, the difference between where a trade is entered and exited is the contract for differences. Instead of buying or selling the underlying asset, you're trading on the asset's price movement. CFDs are leveraged products, meaning you only need a small deposit for a more extensive market exposure. This leverage can magnify your profits and losses if the market moves against you. The main advantage of CFD trading is that it allows you to decide whether a market will rise or fall without buying the underlying asset.
In this context, you can opt to go short (sell) or long (buy) based on your prediction of future price movements. A positive trading outcome occurs when the market moves in your favor. This would be a price increase for a long trader and a price decrease for a short trader.
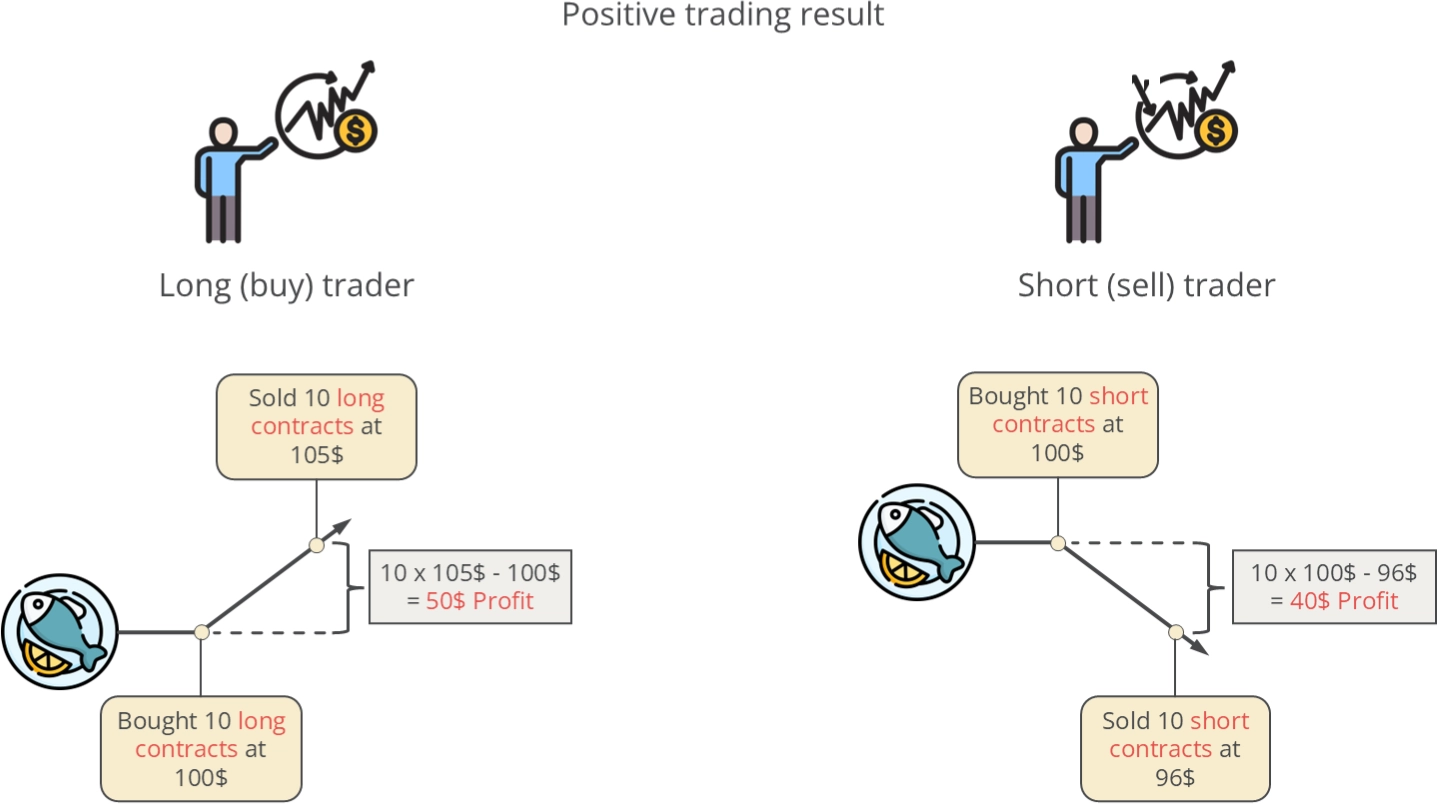
However, it's important to note that if the price moves against your prediction, your trading result will be negative:
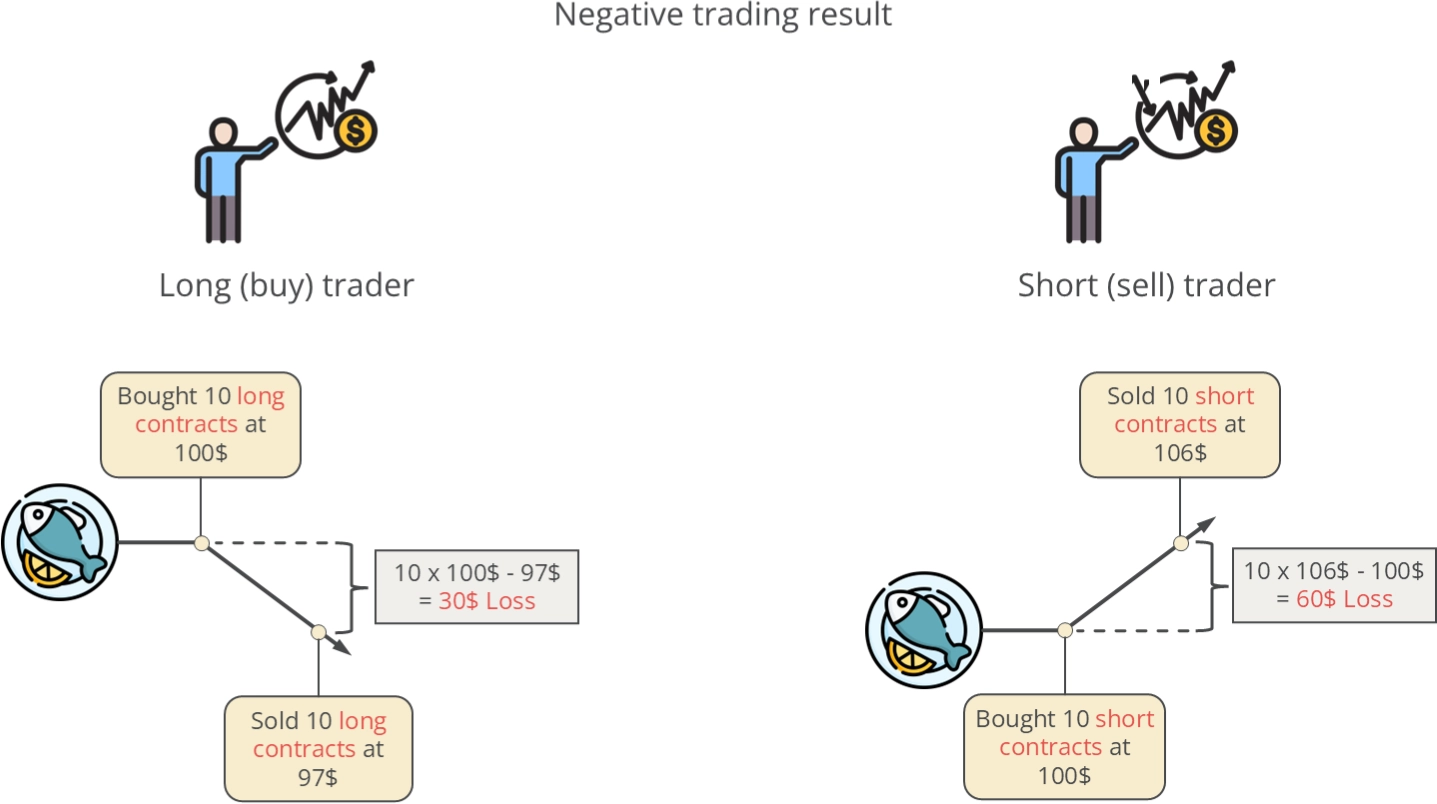
However, it's essential to understand the risks involved, as losses can exceed deposits.
Recommended external content:
Leverage and margin
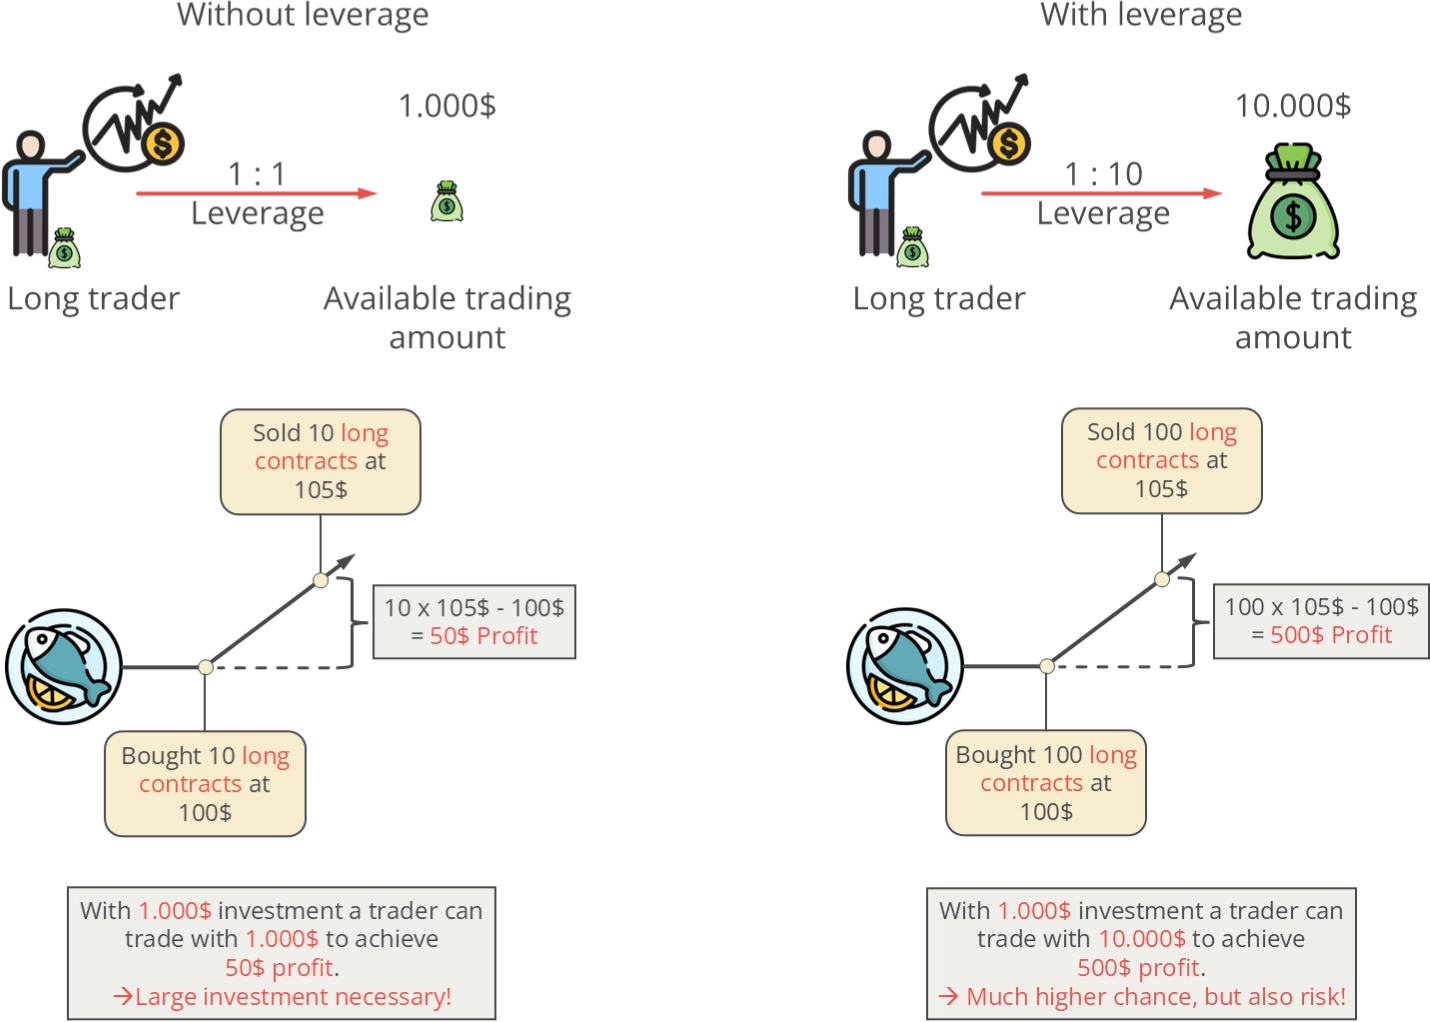
Leverage refers to using borrowed capital to increase the potential return on an investment. Trading allows you to open positions more significant than your account's capital. For example, with leverage of 1:10, you can control a position worth $10,000 with just $1,000 of your capital.
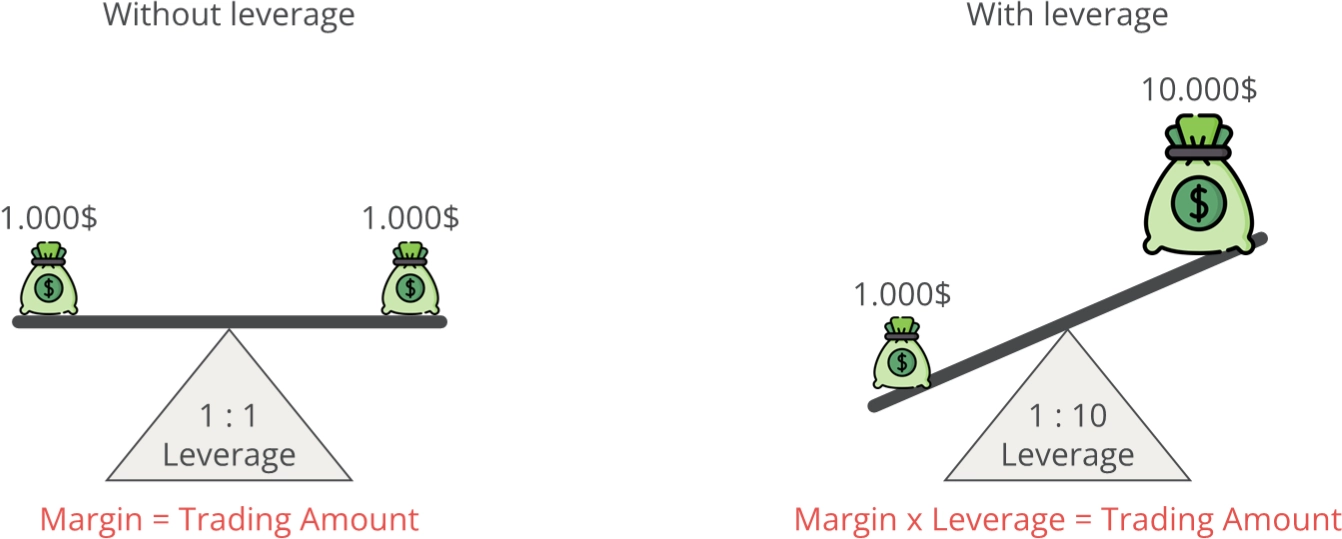
While leverage can magnify profits, it can also magnify losses if the market moves against you. Conversely, the margin is the capital required to open and maintain a leveraged position. It's a good faith deposit that a trader puts up as collateral to hold a position. Margin requirements can vary depending on the broker, the asset being traded, and the trade size. Both leverage and margin are double-edged swords. They can significantly increase your profits when the market moves in your favor, but they can also lead to substantial losses if the market moves against you.
It's crucial to understand and manage these risks effectively.
Recommended external content:
Lot size
In trading and investing, Lot Size refers to the quantity of an asset bought or sold in a single transaction. It's a standardized quantity of units and depends on the asset being traded. In the stock market, for example, a lot size is typically 100 shares, known as a round lot. However, with the advent of online and discount brokers, it's now possible to trade in odd or mixed lots, which can be less than or more than 100 shares.
In the forex market, a standard lot represents 100,000 units of the base currency. There are also mini, micro, and nano lot sizes of 10,000, 1,000, and 100 units respectively. Understanding lot size is essential as it directly impacts the risk and reward of a trade. The larger the lot size, the greater the potential profit or loss. Therefore, choosing a lot size that aligns with your risk tolerance and trading strategy is crucial.
Financial instruments
Forex
The Forex market, short for foreign exchange, is the world's largest and most liquid financial market. It operates 24 hours a day and comprises over 170 different currencies. The total value of the Forex industry is estimated to be around $2.73 quadrillion, with a daily global trading volume of approximately $7.5 trillion as of 2022. The market's deep liquidity allows traders to enter and exit positions instantaneously, making it an ideal market. Its size and depth also mean that large trades do not significantly impact the market price.
Metals
The metals market is a significant segment of the commodities market. It includes precious metals like gold, with a global market size of approximately $170 billion as of 2019. The base metals market, which includes copper, zinc, lead, nickel, aluminum, and tin, is expected to grow from 127.39 million tons in 2023 to 152.91 million tons by 2028. The rare earth metals market, crucial for emerging technologies like hybrid and electric vehicles, was valued at around $13.2 billion in 2019. These figures highlight the substantial size and economic impact of the metals market.
Cryptocurrencies
The cryptocurrency market, which includes digital assets like Bitcoin and Ethereum, is a rapidly growing sector of the global financial system. The market size was valued at around USD 826.6 million in 2020 and is projected to grow to USD 1,902.5 million by 2028, exhibiting a compound annual growth rate (CAGR) of 11.1% from 2021 to 2028. This growth is driven by factors such as the rise of distributed ledger technology, increasing digital investments, and the growing popularity of digital assets. The market's size and growth potential make it a significant financial instrument in today's digital age.
Indices
Indices are a financial instrument that tracks the performance of a specific group of stocks or other assets. They provide a snapshot of the overall health of a particular market or sector. The size of an index is typically measured by its market capitalization, which is the total value of all the stocks or assets it tracks. Based on their constituents ' market capitalization, some of the world's largest indices are the S&P 500, Dow Jones Industrial Average, and Nasdaq Composite in the United States. Other significant indices are the DAX in Germany, the FTSE 100 in the UK, and the Nikkei 225 in Japan.
Energies
The energy market is a broad sector that includes various energy sources such as oil, gas, coal, and renewable energy. The global energy industry is responsible for providing many basic needs and is involved in producing, producing, refining, and distributing energy sources. As populations grow and low-income countries move towards urbanization, the energy demand is expected to increase. The renewable energy market, a subset of the energy market, was valued at around USD 1.1 trillion in 2022 and is projected to grow significantly in the coming years.
Stocks
The stock market, which includes financial instruments like shares of companies, is a significant part of the global economy. As of 2023, stock markets in the United States accounted for nearly 60 percent of world stocks. The total market capitalization of all publicly traded securities worldwide was estimated at around $93.7 trillion at the end of 2020. The world's largest stock exchanges include the NYSE, with a market value of $28.19 trillion, and the Nasdaq, with a market value of $12.98 trillion. These figures highlight the substantial size and economic impact of the stock market.
Recommended external content:
Order types
A trading order is a directive an investor or trader gives to a broker or trading platform to buy or sell a financial instrument like stocks, bonds, or derivatives. Each type of order offers different levels of speed, price control, and protection, allowing investors to choose the one that best suits their trading strategy.
There are several types of trading orders.
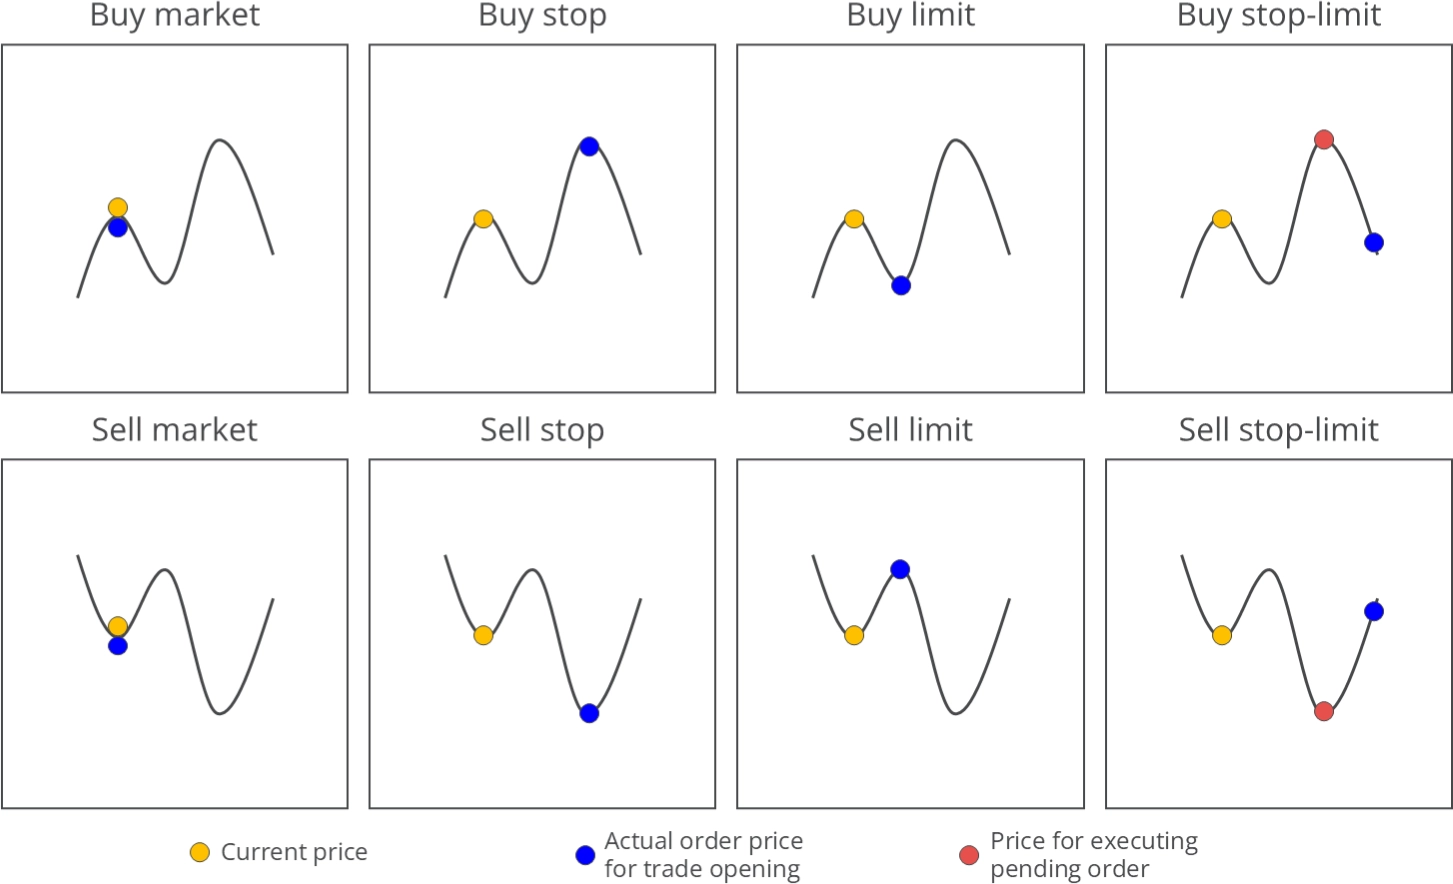
Buy
This is an order to buy a security at the current market price. It's executed immediately at the best available price.
Buy Limit
This is an order to buy a security at a specific price or lower. It provides control over the price but does not guarantee execution.
Buy Stop
This order becomes a market order to buy once a certain price level is reached. It's often used to limit potential loss or protect profits on a short sale.
Buy Stop-limit
Once the stop price is reached, the stop-limit order becomes a limit order to buy at the limit price or lower.
Sell
This is an order to sell a security at the current market price. It's executed immediately at the best available price.
Sell Limit
This is an order to sell a security at a specific price or higher. It provides control over the price but does not guarantee execution.
Sell Stop
This order becomes a market order to sell once a certain price level is reached. It's often used to limit potential loss or protect profits on an extended position.
Sell Stop-limit
Once the stop price is reached, the stop-limit order becomes a limit order to sell at the limit price or higher.
Recommended external content:
Trading platforms
A trading platform is a software application that allows traders and investors to open, close, and manage positions through a financial intermediary. These platforms have various features, such as real-time quotes, charting tools, and news feeds. Platforms may also include features to maintain and manage capital, risk, and other trading activities. There are two types of trading platforms: prop platforms and commercial platforms. Prop platforms are customized platforms developed by large brokerages to suit their specific requirements and trading styles. Commercial platforms have a generic interface and are available to individual clients and brokerages. Trading platforms can be local or web-based. Local platforms must be installed on the user's computer, while web-based platforms can be accessed from anywhere. Most trading platforms are free for any trader. However, some platforms may require a subscription.
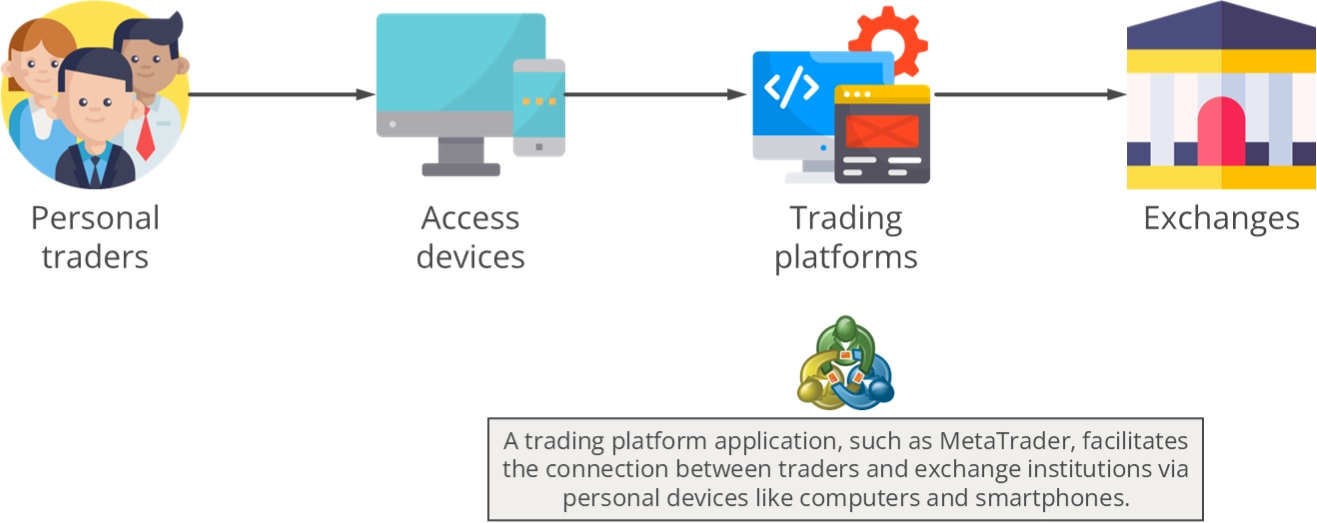
MetaTrader is a popular trading platform for online retail foreign exchange speculative traders. It provides tools and resources for analyzing price dynamics, making trade transactions, and creating and using automated trading programs. MetaTrader is known for its innovative features like real-time access to market prices, live charts, technical analysis tools, and multiple order types. It is widely recognized for its user-friendly interface and is available in desktop, web, and mobile versions. Developed by MetaQuotes Software, MetaTrader comes in two primary versions: MetaTrader 4 (MT4) and MetaTrader 5 (MT5), each catering to different trading needs.
To familiarize yourself with MetaTrader, start with the MetaTrader Simplified tutorial.
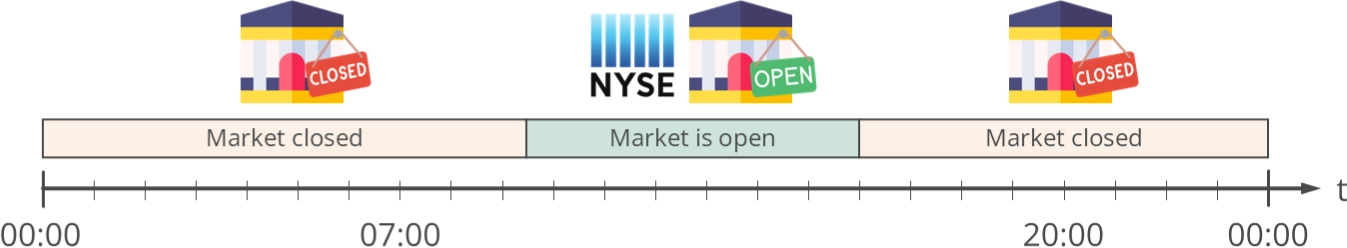
Market hours and swap
Market hours refer to the operating hours of financial markets. Each market around the world has specific trading hours. For instance, the New York Stock Exchange operates from 9:30 a.m. to 4:00 p.m. Eastern Time, Monday through Friday. On the other hand, Forex markets work 24 hours a day from 5 p.m. EST on Sunday until 4 p.m. EST on Friday because at least one financial center in the world is always open for business.
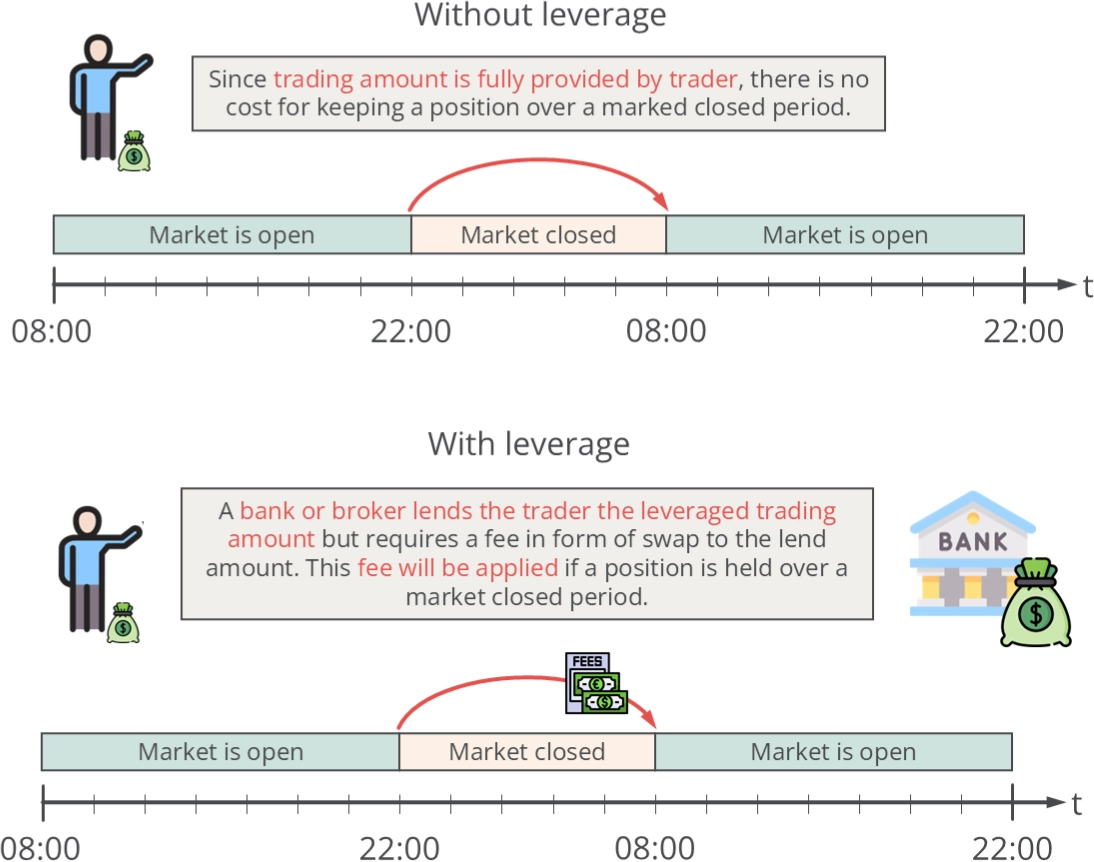
Swap refers to the interest you earn or pay by holding a position when the market is closed. This interest is charged on the nominal value of an open trading position. The swap value can be either negative or positive, depending on the swap rate and the position taken on the trade. When you open a leveraged position, you borrow funds, resulting in an interest charge. The currency you buy will earn you interest, and if the underlying interest rate for the purchased currency is higher than the currency you are selling, you could earn interest. However, due to considerations like a broker's markup, you might be charged interest regardless of the position opened.
There are two types of swaps to consider: weekday and weekend swaps. The primary distinction between weekday and weekend swaps lies in the number of days they encompass. It's crucial to understand that a swap can be either positive or negative, depending on the specific currency pair and the direction of the trade. Traders should review their broker's swap rates to comprehend the potential costs or gains.
Weekday swap
Weekday swaps apply to positions that are held open during the week. If you hold a position at the end of the trading day, you may pay or receive interest based on the rates of the currencies in your pair and the type of position you hold.
Weekend swap
Weekend or triple swap is applied for three days on Wednesdays (or Fridays, depending on the broker) to account for the settlement of trades over the weekend when the markets are closed. The triple swap accounts for Saturday and Sunday interest.
Recommended external content:
Commission
In trading, a commission is a service charge assessed by a broker or investment advisor for providing investment advice and handling the purchase or sale of a security. Commissions vary widely from broker to broker. Some charge a flat fee per trade, while others charge a percentage of the total transaction value. Sometimes, commissions are based on a sliding scale depending on the transaction size, type, or frequency. They compensate the broker or investment advisor for their time, expertise, and the resources they expend to execute trade orders. Investors need to understand how and when commissions are charged, as these costs can impact the overall profitability of their investments.
Recommended external content:
Stop loss and take profit
Stop loss and take profit are two important order features used in trading to manage risks and secure profits.
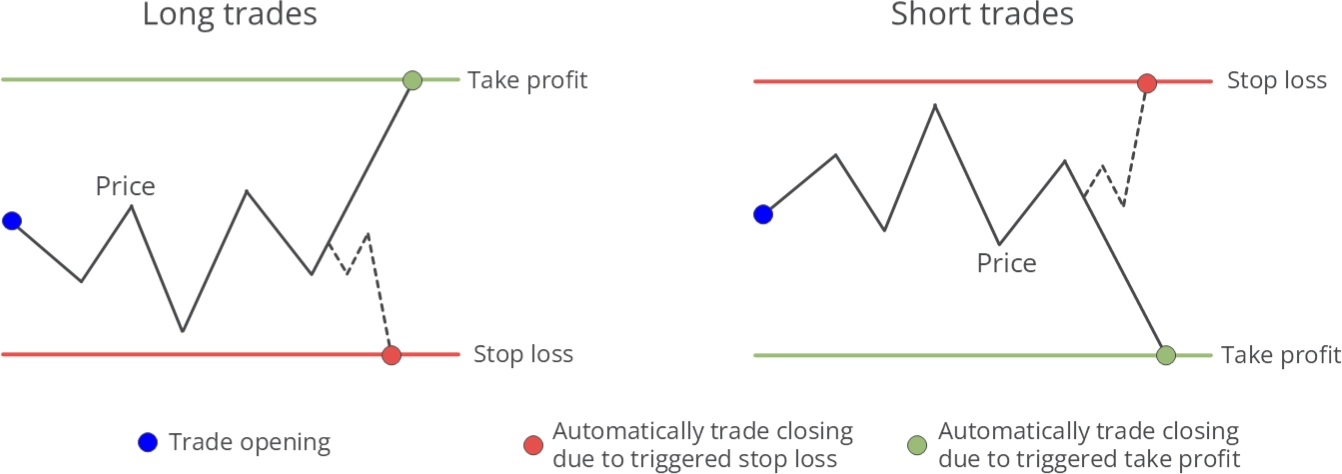
Both stop loss and take profit orders are essential risk management tools in trading. They allow traders to specify the price at which they want to close a position to limit a loss or lock in a profit, providing automation in trade execution.
Stop loss
Stop Loss (SL): This order is placed to sell a security when it reaches a specific price. It's designed to limit an investor's loss on a position. For example, if you bought a stock at $50 and set a stop loss at $45, the stock would be sold automatically if the price drops to $45, limiting your loss to $5 per share.
Take profit
Take Profit (TP): This order is placed to sell a security when it reaches a specific price to secure a profit. For example, if you bought a stock at $50 and set a take profit at $60, the stock would be sold automatically when the price reaches $60, securing your profit.
Recommended external content:
Trailing limits
Trailing stop loss and take profit are sophisticated trading features designed to adjust the take profit and stop loss levels as the market price fluctuates.
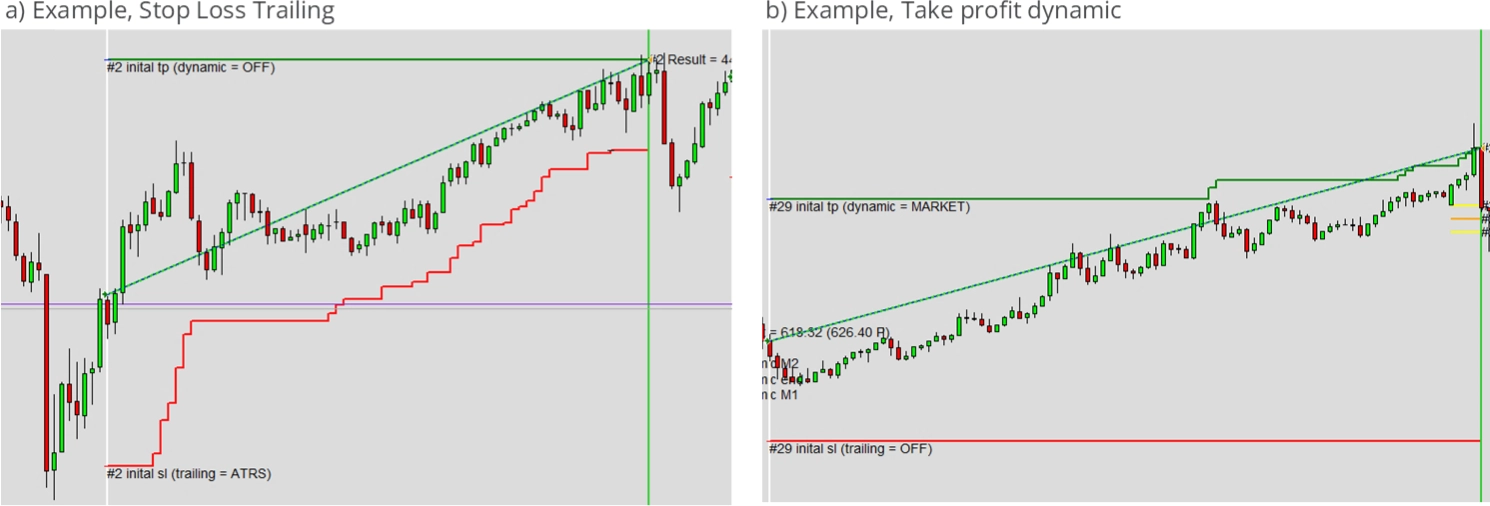
These trailing limits provide more flexibility and potential profit than fixed stop losses and take profits.
Trailing Stop loss
This is a type of stop loss that moves with the market price. You set a distance from the market price; if the price moves favorably, the stop loss moves, maintaining the specified distance. If the market price moves unfavorably, the stop loss remains at its most recent position. This allows you to lock in more profits or limit losses if the market reverses after moving in a favorable direction.
Trailing Take Profit
A trailing take profit is an advanced method that adapts to rapidly changing prices. It can be beneficial to adjust the take profit level to optimize profits. It's important to note that this feature should only be utilized when managed by an algorithm. This type of limit adjustment can be beneficial in trading within smaller timeframes, as is typical for scalping and day trading. A common scenario for its use would be in response to news events that are expected to cause significant price volatility.
Recommended external content:
Trade splitting
Trade splitting, or lot splitting, is a strategy used in trading where a large order is divided into multiple smaller orders. This is done to manage risk, to avoid impacting the market price significantly with a large order, and to hide the total order size from other market participants. By splitting a trade, traders can get a better average execution price. It's a common practice in algorithmic trading where computer algorithms automatically split large orders into smaller ones based on predefined criteria.
Recommended external content:
Hedging
With an opposing asset
Hedging with an opposing asset is a risk management strategy in trading and investing. It involves taking an offsetting position in a related but opposing asset to protect against potential losses in an investment.
For example, if an investor owns shares in a technology company, they might hedge against potential losses by shorting an index that tracks the technology sector. If the technology sector declines, causing the investor's shares to lose value, the short position on the technology index would likely result in a gain, offsetting some or all of the losses from the shares.
Similarly, a gold mining company might hedge against fluctuations in the price of gold by selling gold futures contracts. If the price of gold falls, the loss in the company's revenue could be offset by gains from the futures contracts.
A related example in Forex trading would be the contrasting behavior of the EURUSD and USDCHF pairs.

Hedging with an opposing asset can provide insurance against unfavorable price movements, but it also involves costs and can limit potential profits. Therefore, it's essential for investors and traders to carefully consider their risk tolerance and investment objectives when implementing hedging strategies.
With same asset but opposite order type
Hedging with sell orders is a strategy used in trading to protect against potential losses. It involves opening a sell order for an asset that you already own. For example, if you own shares of a company and you're worried that the price might fall, you could open a sell order at a specific price. If the price of the shares falls to the level of your sell order, the order will be executed, limiting your losses.
This strategy can also be used in forex trading. If you have a long position in a currency pair and believe the price might fall, you could open a sell order for the same currency pair. If the price decreases, the profit from the sell order could offset the loss from the long position.
However, it's important to note that hedging with sell orders can also limit potential profits. If the asset price rises instead of falling, the sell order could result in a loss.
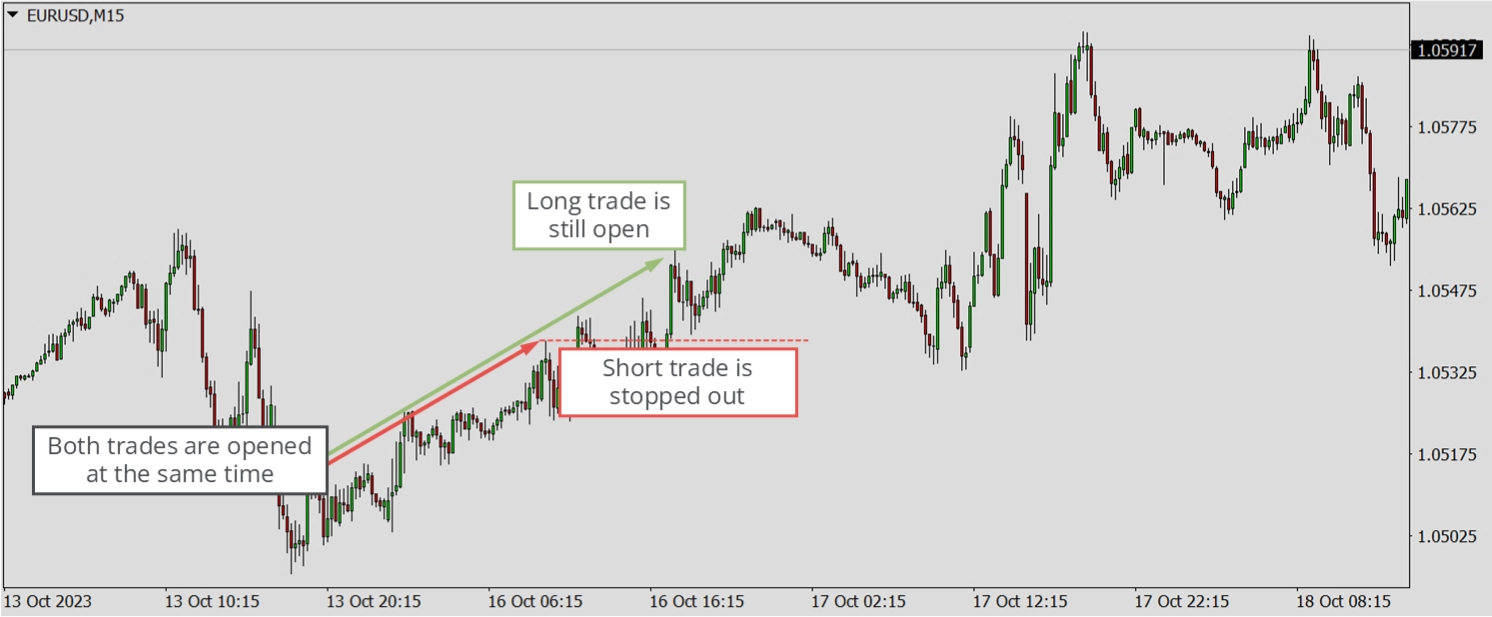
This strategy should be used carefully and with a clear understanding of the potential risks and rewards.
Recommended external content:
Symmetric and asymmetric charts
In trading, charts can be separated into symmetric and asymmetric.
Symmetric charts
Symmetric charts represent scenarios where both sell, and long traders form two equivalent groups. This is typically applicable to currency pairs. For instance, in the EURUSD pair, when someone sells USD, another person buys EUR. This implies that there are approximately equal forces from both sides. Over a long-term period, the price oscillates around a relatively fixed value. The exchange rate between two economic regions usually stays primarily static, fluctuating around a specific value. Only in extreme events like hyperinflation in one currency can a forex market be considered asymmetric.
Asymmetric charts
Asymmetric charts, on the other hand, can exhibit a long-term trend since the underlying asset is a physical good, such as gold. It's widely known that the price rises statically over a long period, meaning the market mostly favors long traders. Asymmetric markets typically also evolve the behavior that prices decrease faster than they rise. Consequently, the trading strategies for long and short trades may differ significantly. A more common example is the S&P 500, which has, on average, increased by approximately 6-8% annually for over five decades.
Risk and money management
Risk and money management in trading are crucial strategies to protect your capital and maximize profitability. Risk management involves identifying, assessing, and reducing risk exposure. It includes setting stop-loss orders to limit potential losses and diversifying your portfolio to spread risk. Money management refers to how much of your capital you're willing to risk on each trade. It involves determining the size of your positions and how much money to invest in each trade. Both strategies require discipline, a precise trading plan, and an understanding of the market. They help traders avoid making impulsive decisions based on emotions, thus increasing the chances of success in trading.
Stop loss and order volume
To calculate the volume size based on stop loss, you must first determine how much of your account you will risk on each trade. This is usually a percentage of your total account balance. Then, you calculate the distance between your entry point and your stop loss level. The volume size is then calculated by dividing the money you're willing to risk by this distance. This ensures that if your stop loss is triggered, you will only lose the predetermined amount of your account. Please note that this is a simplified explanation, and actual calculations may vary depending on the asset you're trading and your broker's requirements.
Take profit and risk ratio
The risk ratio in trading is the ratio of the potential risk (stop loss) to the potential profit (take profit). A risk ratio 1:2 means you're willing to risk $1 to make $2. To set the take profit level, you first determine your desired risk ratio. Then, you put your take profit level based on your stop loss level. For example, if your stop loss is ten pips away from your entry point and you want a risk ratio of 1:2, you would set your take profit 20 pips away from your entry point.
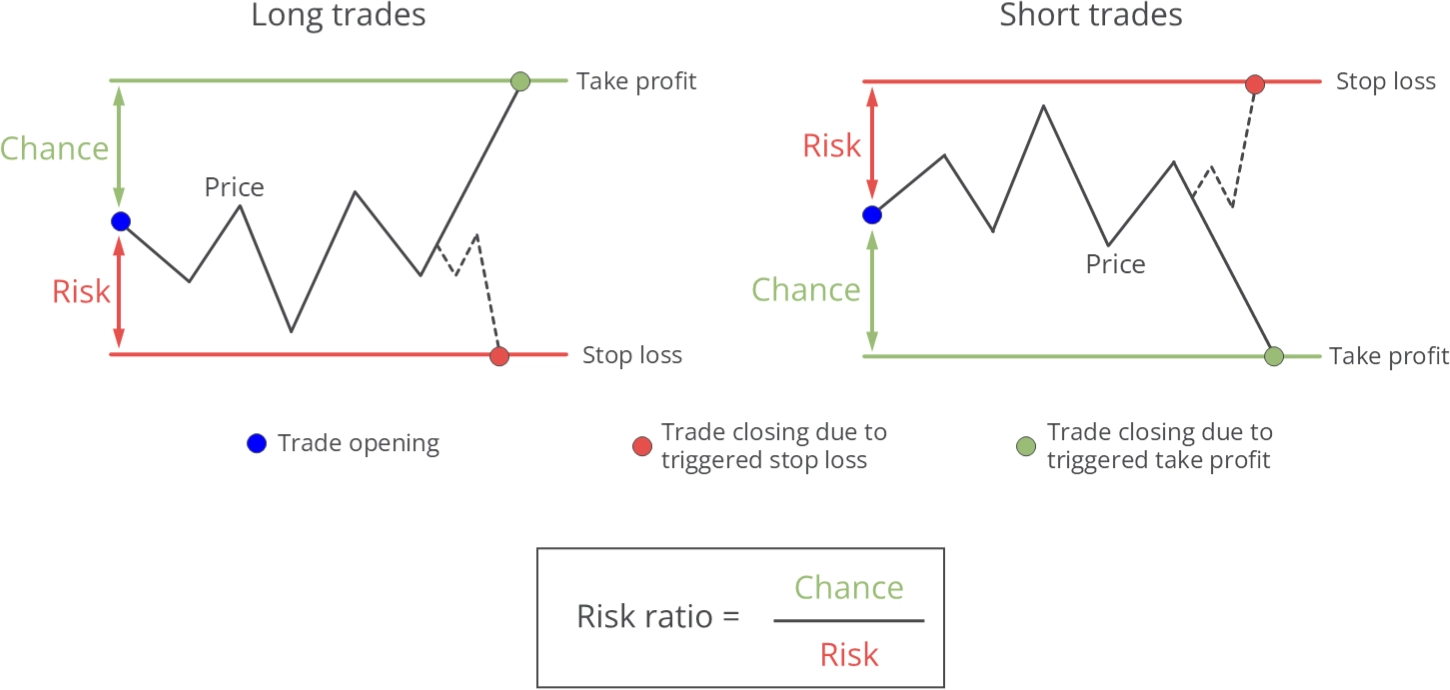
The risk ratio can vary significantly among different trading strategies. A risk ratio of 5-10 is achievable in investing, but attaining the same in a day trading strategy is doubtful. The shorter the timeframe, the lower the risk ratio is likely to be. In swing and day trading, a value of 1.4 is standard practice.
Recommended external content:
Trading journal
A trading journal is a detailed record of all your trades. It's an essential tool for serious traders to track their trading activities and performance over time. The journal typically includes information such as the date and time of the trade, the asset traded, the type of trade (buy or sell), the trade volume, the entry and exit prices, the profit or loss, and any fees or commissions.
In addition to these basic details, many traders also include notes on the market conditions at the time of the trade, their rationale for making the trade, and their emotional state. They may also have charts or other visual aids to help them analyze their trades.
A trading journal aims to help traders identify patterns in their trading behavior, evaluate their strengths and weaknesses, and develop strategies for improvement. By regularly reviewing and analyzing their past trades, traders can gain valuable insights, learn from their mistakes, and make more informed and profitable trading decisions in the future. It's a key component of effective risk management and continuous learning in trading.
Recommended external content:
Evaluation of a trading strategy
In trading, a strategy is typically evaluated based on two key metrics: performance and drawdown.
Both performance and drawdown are essential for assessing the result of a trading strategy. A sound system should maximize performance while minimizing drawdown. This requires careful risk management, diversification, and regular review of the strategy's results.
Performance
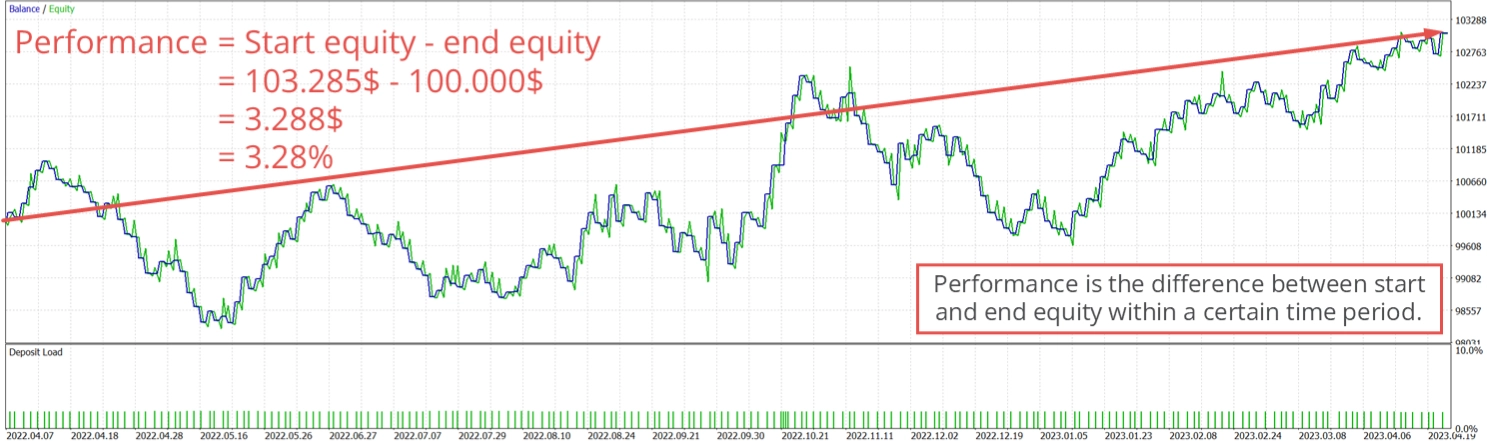
This refers to the strategy's profit or loss over a specific period. It's usually expressed as a percentage of the initial investment. High returns are desirable as they indicate that the strategy is profitable. However, the risk taken shall always be considered as well. A strategy with high returns but also high risk may perform better than a strategy with slightly lower returns but significantly lower risk, but it comes with much higher risk. Thus, the second variant shall be preferred.
Drawdown
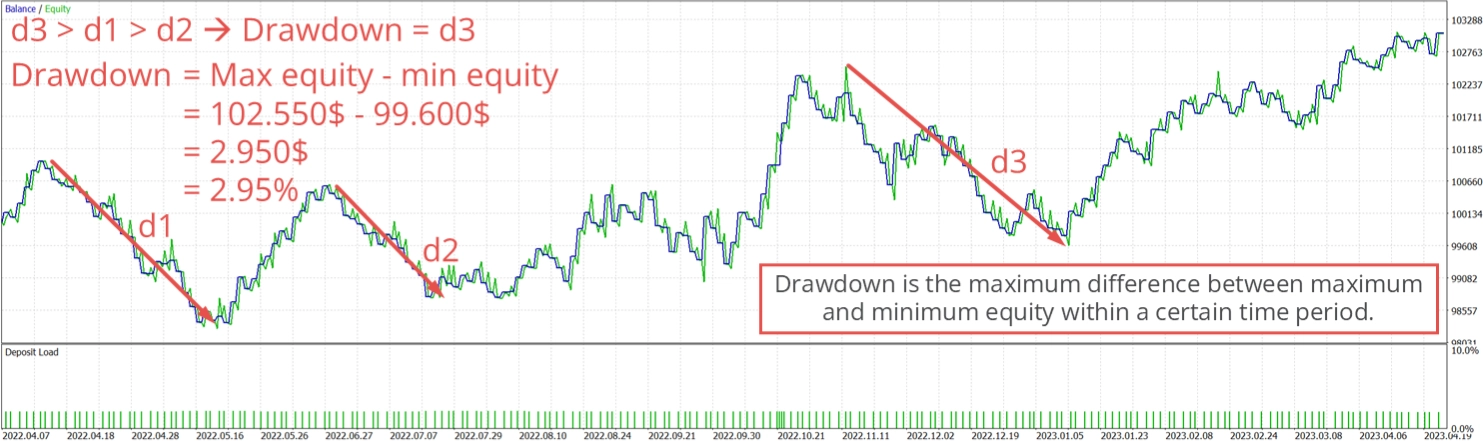
This measures the decline in value from the highest point (peak) to the lowest point (trough) over a given period. It's used to assess the riskiness of a strategy. A high drawdown indicates that the system can result in significant losses, which may be challenging to recover from. For example, if a strategy has a maximum drawdown of 20%, it means that at some point, it lost 20% from a peak before recovering.
Recommended external content:
- Trading Performance Metrics
- Maximum Drawdown (MDD) Defined, With Formula for Calculation
- Drawdown: What It Is, Risks, and Examples
Trading signals
Candle pattern
Candlestick patterns are a form of technical analysis used in trading. Each candlestick represents a specific period and displays the opening, closing, high, and low prices. Patterns of one or more candlesticks can signal potential market movements. For example, a bullish engulfing pattern signals a possible uptrend, while a bearish engulfing pattern signals a likely downtrend. Doji patterns indicate market indecision. Combined with other technical analysis tools, these signals can help traders make informed decisions. However, they're not guaranteed predictors and should be used with caution.
Recommended external content:
Chart pattern
Chart pattern trading signals are used in technical analysis to predict potential price movements. Patterns like Head and Shoulders, Double Top, and Double Bottom can indicate reversals, while Triangles and Flags suggest continuing trends. For instance, a Head and Shoulders pattern signals a bearish reversal after an uptrend. Conversely, a Double Bottom pattern signals a bullish reversal after a downtrend. Triangle patterns can signal a continuation of the current trend, either bullish or bearish. However, these signals could be more foolproof and should be used with other analysis tools.
Recommended external content:
Fibonacci pattern
Fibonacci trading signals are based on Fibonacci retracement levels, a popular tool in technical analysis. Traders draw horizontal lines at the Fibonacci levels of 23.6%, 38.2%, 50%, 61.8%, and 100% on a price chart and watch for potential reversals or continuations. For example, if a price retraces to a Fibonacci level and then starts moving in the original direction, it could signal a continuation of the trend. Conversely, if the price breaks through a Fibonacci level, it could signal a reversal. However, these signals should be used with other technical analysis tools for more accurate predictions.
Recommended external content:
Indicators
Trading indicators are mathematical calculations plotted as lines on a price chart and can help traders identify specific signals and trends within the market. There are different types of trading indicators, including leading and lagging indicators. Leading indicators help to predict price movements before they happen, with examples including the Relative Strength Index (RSI) and Stochastic Oscillator. Lagging indicators offer a signal after the trend has started, including Moving Averages and the MACD. Remember, no indicator can predict market movements with 100% certainty.
Recommended external content:
Oscillators
Oscillators are technical analysis tools that generate trading signals by fluctuating between overbought and oversold levels. They help identify potential reversals by showing when security is overbought (potentially overvalued) or oversold (potentially undervalued). Examples include the Relative Strength Index (RSI), which ranges from 0 to 100, with levels above 70 considered overbought and below 30 considered oversold. Another is the Moving Average Convergence Divergence (MACD), which signals potential buy points when it crosses above the signal line and possible sell points when it crosses below. These signals should be used alongside other indicators for confirmation. In contrast to indicators, oscillator values usually oscillate around affix values. In many cases, this is zero, one, or 100.
Recommended external content:
Elliott waves
Elliott wave theory is a method of technical analysis that traders use to analyze market cycles and forecast trends by identifying extremes in investor psychology, highs and lows in prices, and other collective activities. The theory proposes that markets move in a series of primary trends that consist of five waves in the direction of the primary trend and three corrective waves (a 5-3 move). The completion of the eight-wave cycle is then followed by a similar process, and so on. However, like all trading signals, they should be used with other indicators for confirmation.
Recommended external content:
Support and resistance
Support and resistance levels are fundamental concepts in technical trading strategies. They represent price levels at which a financial asset has historically been unable to move beyond without at least temporarily retreating. Support refers to the level at which demand is strong enough to prevent the price from falling further, while Resistance is a price level where selling is strong enough to prevent prices from rising higher. Traders use these levels to identify opportunities where a price may bounce back (at support) or pull back (at resistance), offering possible entry and exit points for trades.
Recommended external content:
News
News trading involves making trades based on news and economic events. Traders anticipate how the market will respond to news about economic indicators, policy changes, or geopolitical events and make trades accordingly. For example, positive employment data could strengthen a country's currency, providing a potential trading signal. Similarly, an unexpected election result could create market volatility, offering trading opportunities. However, news trading can be risky due to the unpredictable nature of news events and their impact on the market. Therefore, using risk management strategies when trading based on news is essential.
Recommended external content:
Signal types
Lagging signals
A lagging signal is characterized by the signal often appearing after the chart has undergone a significant change. Common examples of this are moving averages, which tend to trigger signals slightly too late. This is an unavoidable behavior due to the nature of an indicator. Nevertheless, in many cases, such indicators or oscillators are still practical algorithms, for instance, for detecting long-term trends.
Recommended external content:
Coincident signal
In theory, obtaining a coincident trading signal is not possible. The closest approximation to this would be news events, which often have an immediate and potent impact on the chart. This has little to no effect on most long-term strategies, but news is one of the most crucial signal generators for short-term strategies such as scalping or day trading.
Recommended external content:
Leading signals
Leading signals are often generated by oscillators designed to predict price movements before they happen. These signals are used to enter or exit trades before the market moves significantly. Examples of leading indicators include the Relative Strength Index (RSI) and the Stochastic Oscillator. These indicators suggest potential price movements based on market momentum, trend strength, and other factors. For instance, an overbought signal from the RSI could indicate that the price is due for a reversal, providing an immediate leading signal to sell.
Recommended external content:
Broker types
A broker is an individual or firm that acts as an intermediary between an investor and a securities exchange. They facilitate transactions between buyers and sellers in exchange for a commission or fee. Brokers can deal in assets such as stocks, bonds, commodities, currencies, and derivatives. They provide services like order execution, research and advice, portfolio management, and financial planning.
Some brokers offer a wide range of services (full-service brokers), while others focus on executing trades at the lowest possible cost (discount brokers). To protect investors, brokers must be licensed to operate and regulated by financial authorities. Before engaging their benefits, investors must understand a broker's services, fees, and reputation.
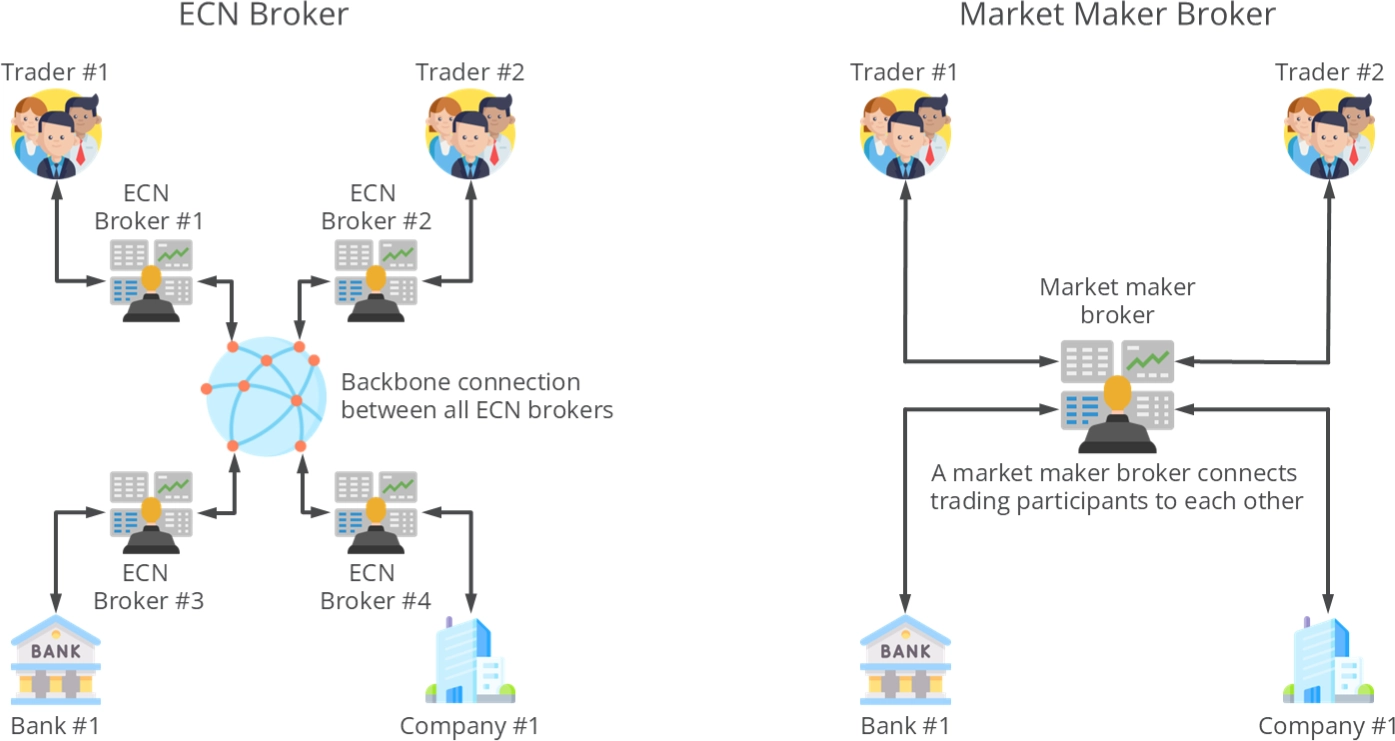
ECN broker
An ECN broker, or Electronic Communication Network broker, is a financial expert who uses electronic systems to match trades between market participants rather than trading on clients' behalf. They provide direct access to other participants in currency markets. Because an ECN broker consolidates price quotations from several market participants, it can generally offer its clients tighter bid/ask spreads than otherwise. ECN brokers are non-dealing desk brokers, meaning they do not pass orders through a dealing desk. Instead, they electronically match participants in a trade and pass the orders to liquidity providers. They are compensated through a commission on each trade or a spread markup.
Market maker broker
A Market Maker broker is a firm or individual who actively quotes two-sided markets in security, providing bids and offers (known as asks) along with the market size. Their primary function is to provide liquidity, essentially making the market. They profit from the Spread between the bid and ask price. Market makers are typically large banks or financial institutions. In the context of the stock exchange, they buy and sell stocks from their inventory to mitigate the risk of price volatility. In contrast to ECN brokers, market maker brokers may not represent the best available pricing for a particular trading instrument due to the potential for conflicts of interest.
Recommended external content:
Timeframes and fractals
Trading timeframes refer to the duration that traders hold their positions open. They can range from very short (like scalping, where trades may last seconds to minutes) to medium (day trading, where trades are closed by the end of the day) to long (swing trading, where trades may last weeks to months), and even longer (position trading, where trades may last several months to years). The choice of timeframe depends on a trader's strategy and risk tolerance.
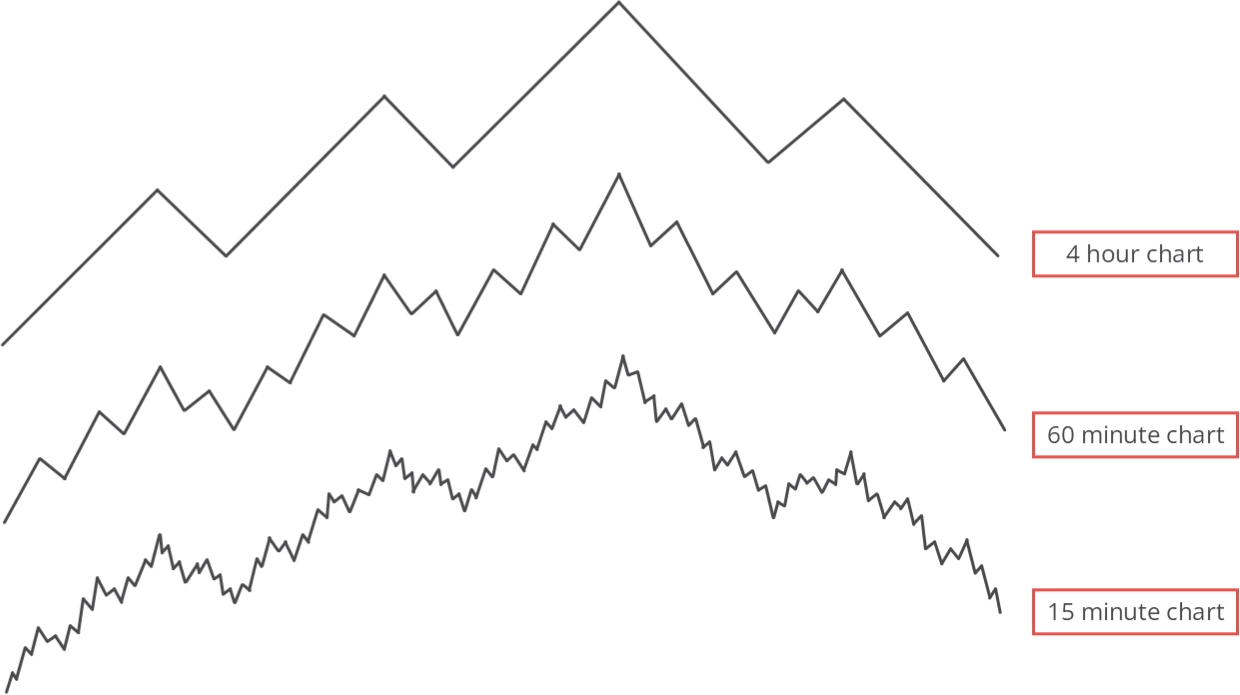
In mathematics, fractals are self-similar shapes that appear the same at any scale. If you zoom in on a fractal, you'll see the same pattern repeating repeatedly, no matter how much you zoom in. This property is called scale invariance. Fractals are complex, detailed, and infinitely intricate. They can be found in nature in snowflakes, coastlines, and ferns. Famous examples of mathematical fractals include the Mandelbrot and Julia sets. Fractals have applications in various fields, including computer graphics, physics, and data modeling and trading.
Recommended external content:
Volatility
In trading, volatility refers to the rate at which the price of an asset increases or decreases for a set of returns. The standard deviation of the logarithmic returns typically measures it. High volatility means that a security's price can change dramatically quickly, making it possible for investors to experience significant gains or losses. Investments with high volatility are considered riskier.
Volatility can be influenced by factors like changes in market sentiment, economic events, or news that directly relates to the asset. Traders can use various strategies, such as buying options or volatility index futures, to hedge against high volatility.
Understanding volatility is crucial for traders because it helps them assess an investment's risk and potential reward. It also gives traders insights into securities' behavior, helping them make more informed decisions. Volatility is critical in various trading strategies used in different financial models.
Recommended external content:
Trading styles
Scalping
Scalping is a high-speed trading style where a trader frequently seeks to take small profits. This strategy involves opening and closing trades within minutes or seconds, aiming to capture quick movements in price. As these traders are called, Scalpers typically place numerous transactions daily, hoping that small profits from each trade will accumulate. They often use technical analysis and trading systems to identify opportunities. Scalping requires a strict exit strategy, as losses can quickly offset gains. It's a demanding strategy that requires significant time, concentration, and experience. It's not recommended for beginners due to its high risk and fast pace.
Recommended external content:
Daytrading
Day trading is a style of trading where positions are entered and exited within the same trading day. This means that traders do not hold any trading positions overnight. Day traders aim to capitalize on price movements in highly liquid markets, typically equities or forex. They use a variety of strategies, including swing trading, arbitrage, and trading news events. Day trading requires high focus and discipline, as traders must monitor the markets and their positions throughout the day. It also requires a solid understanding of technical analysis and charting systems. While it can be profitable, day trading is also high-risk, resulting in significant financial losses.
Recommended external content:
Swing trading
Swing is a style of trading that attempts to capture gains in a financial instrument within one day to several weeks. Unlike day trading, swing traders hold positions for more than a day, typically up to several weeks. Swing traders primarily use technical analysis, looking for patterns and trends in the price charts, and may also utilize fundamental analysis. The goal is to buy (or sell) a security at the beginning of an upswing (or downswing) in price, then sell (or buy) it when the swing ends. This style requires patience and a good understanding of market timing.
Recommended external content:
Value Investing
Value investing is a trading style where investors actively seek stocks they believe the market has undervalued. Investors who use this strategy believe the market overreacts to good and bad news, causing stock price movements that do not correspond to a company's long-term fundamentals. The overreaction offers an opportunity to profit by buying stocks at discounted prices - on sale. The central tenet of value investing is that the intrinsic value of a stock is not always accurately reflected by its current price. It requires rigorous analysis to identify undervalued stocks and patience to wait for the market to correct the undervaluation.
Recommended external content:
Automated trading
Automated or algorithmic trading involves using computer programs and systems to enter and exit trades based on predefined criteria. The criteria can be found in various trading strategies like arbitrage, trend following, scalping, or a combination. The main advantage of automated trading is that it can process vast amounts of data and execute trades more quickly and accurately than a human trader. It also eliminates emotional and psychological biases that can affect trading decisions. However, it's not without risks. Automated trading systems can fail due to network connectivity issues, system failures, or discrepancies between the programmed strategy and market conditions. Therefore, continuous monitoring is necessary to ensure the system functions as intended.
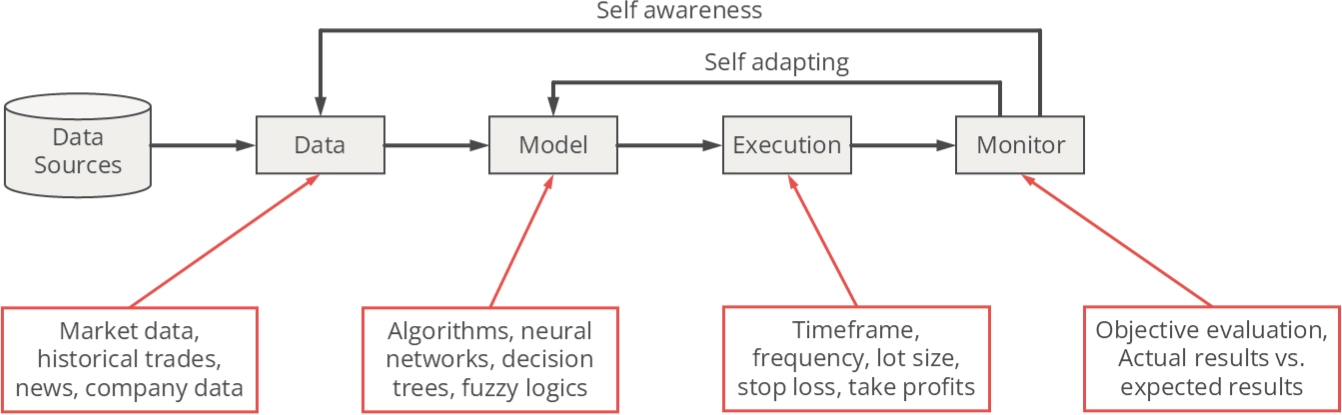
Modern automated trading strategies incorporate self-awareness and adaptability to adjust to fluctuating market conditions. This necessitates a sophisticated analysis of feedback data from the underlying trading logic.
Recommended external content:
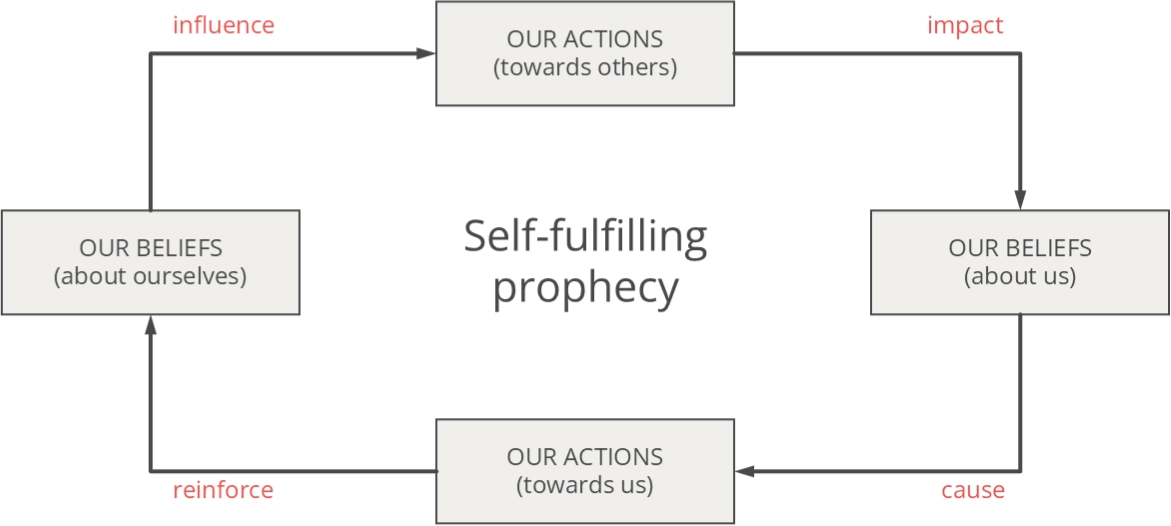
Self-fulfilling prophecy
A self-fulfilling prophecy is a belief or expectation that influences people to act in ways that make the idea come true. It's a psychological phenomenon where a person unknowingly causes a prediction to come true because they expect it to come true. This concept is often used in various social contexts, including economics, psychology, and sociology. For example, suppose a teacher believes a student to be academically gifted. In that case, they may provide the student with extra attention and more challenging material, improving the student's performance and thus fulfilling the prophecy. Conversely, negative expectations can lead to a decrease in performance. The concept highlights the importance of mindset and expectations in shaping behavior and outcomes.
In the context of trading, a self-fulfilling prophecy refers to a prediction or expectation that influences traders' behavior in a way that causes the prediction to come true.
For instance, technical analysis tools such as support and resistance, trendlines, and moving averages have predictive qualities. If many traders base their decisions on these indicators, they could collectively push the price in the predicted direction. This is because their collective actions can influence the market in a way that confirms their expectations.
An example is when many technical traders place a stop-loss order below the 200-day moving average of a particular company. If the stock reaches this price, there will be a large number of sell orders, which will push the stock down, confirming the movement traders anticipated. Then, other traders will see the price decrease and sell their positions, reinforcing the trend's strength. This short-term selling pressure can be considered self-fulfilling.
However, it's important to note that while standard signals generated by technical analysis can be self-fulfilling and push the price of security higher or lower, reinforcing the strength of the signal, this may last only for a short time. Because the goals of participating investors and traders differ and hundreds of indicators inform these market players - not to mention fundamental forces that drive prices - it becomes nearly impossible for technical analysis to be self-fulfilling in the long run.
Recommended external content:
Complex chaotic system
A complex, chaotic system in trading refers to a market that exhibits systemic and random behaviors. These systems are vulnerable to minor changes, which can disrupt the system, pushing it far from equilibrium.
Chaos, a complicated mathematical theory, is often applied to financial markets to explain chaotic or random occurrences. It explores the effects of minor occurrences that can dramatically affect the results of seemingly unrelated events.
For example, the stock market is a complex, chaotic system. Its behavior has both systemic and random components. Stock market forecasts can be precise only to a certain extent. As proven by Edward Lorenz, the pioneer of chaos theory, complex chaotic systems are vulnerable to minor changes, which can disrupt a system, pushing it far from equilibrium.
In finance, chaos theory argues that price is the last thing to change for a security. Using chaos theory, a price change is determined through mathematical predictions of the following factors: a trader's motivations (such as doubt, desire, or hope, all of which are nonlinear and complex), changes in volume, the acceleration of changes, and momentum behind the changes.
Recommended external content: