No.42: Detecting of market underestimations
Description
You can find an example for the Expert Advisor Builder on this page. If you need to familiarize yourself with the MetaTrader strategy tester and the Expert Advisor Builder, please begin with the Getting Started article.
This example demonstrates the use of the chart analyzer engine. The chart analyzer is a signal generation tool that simplifies the chart through a non-algorithm-based calculation method. With a wide range of conditions, it can detect almost unlimited different and complex chart patterns. Some are quickly evaluated by on/off switches, while others can see the exact form of the previous chart. Chart analyzers offer the significant advantage of producing reliable and reproducible signals over a long period.
Market underestimations are detected and visualized in the trading module example on this page. Each time such a phase begins, a long order with an average true range trailing stop loss and risk ratio-based take profit is placed. As with many examples for the Expert Advisor Builder, only one trade can be open at a time.
Please note that this is not a plug-and-play trading strategy. A trading strategy needs suitable adjustments, fine-tuning to the timeframe and symbol, and thorough backward and forward testing. Therefore, providing fully working trading strategies as read-to-use examples is impossible. However, this example could serve as a foundation for your trading strategy.
Reset of inputs
Locate the Expert Advisor Builder application in the dropdown menu of the strategy tester settings under FEA Trading\MT4\Expert Advisor Builder 2.0 if you're using a MetaTrader 4 instance or FEA Trading\MT5\Expert Advisor Builder 2.0 if you're using a MetaTrader 5 instance. You can replicate the entire example in minutes by following the steps outlined in this article. To begin, kindly reset the strategy tester input as indicated.
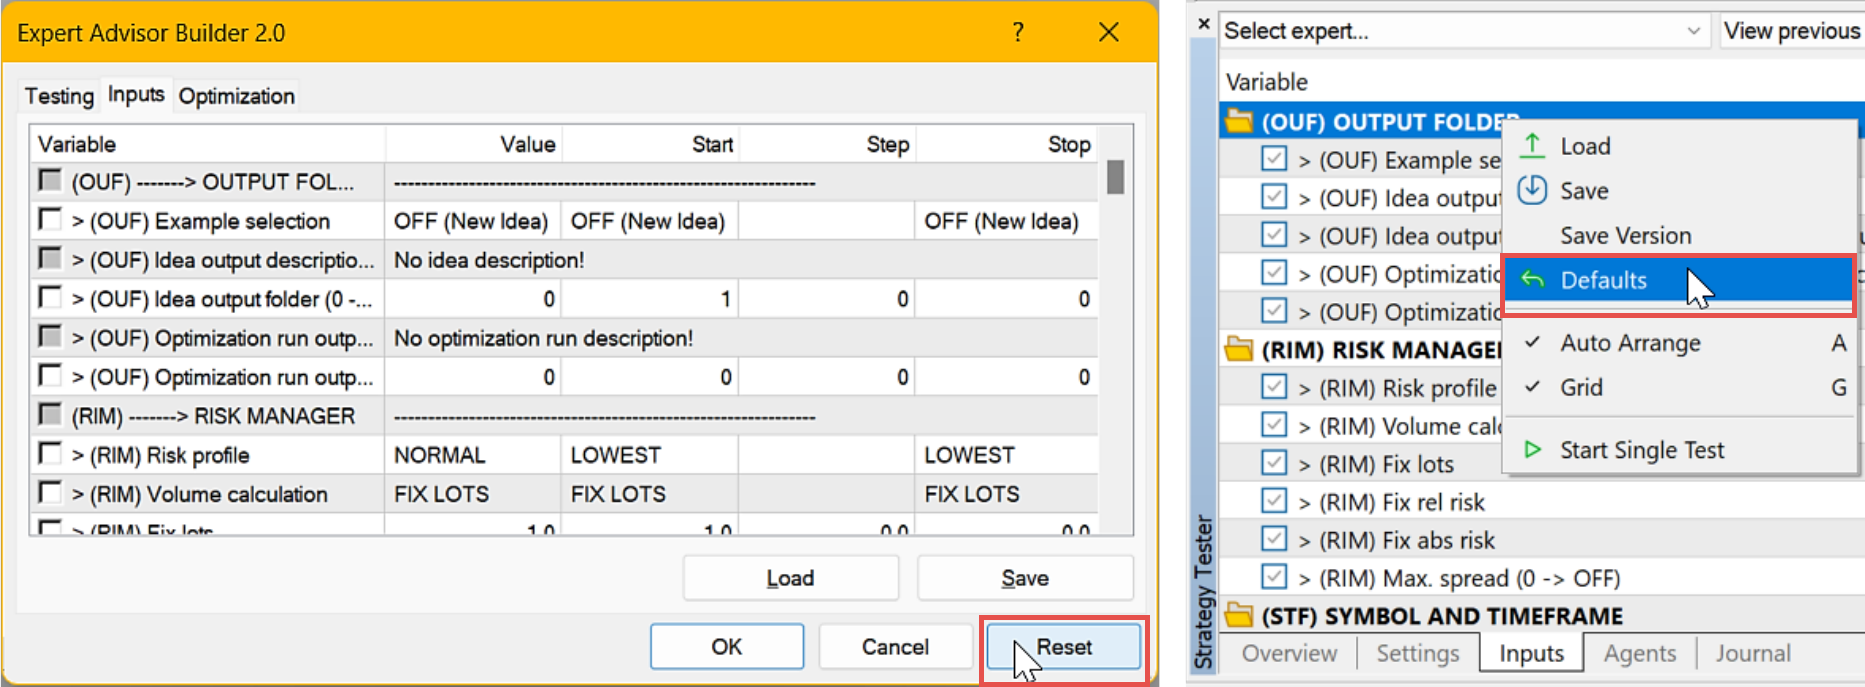
The default input parameters of the Expert Advisor Builder are designed to be highly functional. This implies that only some parameters must be adjusted when creating a new strategy. As a result, even with minimal reconfiguration, the output strategy can be significantly different.
Inputs configuration
Most examples can be executed in any timeframe and on any symbol. However, please set EURUSD as the symbol to be tested, M15 as the timeframe, select Open prices only (MT4) or 1 minute OHLC (MT5) as the model, and the previous four weeks as the test period. Finally, enable the visual testing mode.
Refer to the table below to set up the input parameters for the Expert Advisor Builder.
| Input variable within MetaTrader (Identifier in SET file) | Example value | User manual chapters |
|---|---|---|
| > (OUF) Idea output description (max 63 characters) (IN_strOufIdeaOutputDescription) | No.42: Detecting of market underestimations | Output Folder |
| > (ITP) Risk ratio (IN_dItpRiskRatio) | 4.0 | Initial Take Profit |
| > (PEO) Mode (IN_enmPeoMode) | SUB | Pending Orders |
| > (PEO) Expiration (<0 -> Seconds, 0 -> OFF, >0 -> Bars) (IN_nPeoExpiration) | 50 | |
| > (PEO) Market HiLo range (IN_nPeoMarketHiLoRange) | 20 | |
| > (CA1) CONF, Signal in use (IN_enmCa1SignalInUse) | ON | Configuration Example with CA1 Example with CA2 Example with CA3 and CA4 combined |
| > (CA1) CONF, Signal visualization (IN_enmCa1SignalVisualization) | ON | |
| > (CA1) CONF, Draw base (IN_enmCa1DrawBase) | OFF | |
| > (CA1) CONF, Draw extrema (IN_enmCa1DrawExtrema) | OFF | |
| > (CA1) CONF, Draw sup res (IN_enmCa1DrawSupRes) | OFF | |
| > (CA1) COND, Trade swing phase overstatement (IN_enmCa1TradeSwingPhaseOverstatement) | OFF | |
| > (CA1) COND, Trade swing phase over correction (IN_enmCa1TradeSwingPhaseOverCorrection) | OFF | |
| > (CA1) COND, Trade swing phase under correction (IN_enmCa1TradeSwingPhaseUnderCorrection) | OFF | |
| > (CA1) COND, Trade swing phase upswing (IN_enmCa1TradeSwingPhaseUpswing) | OFF | |
| > (CA1) COND, Trade swing phase downswing (IN_enmCa1TradeSwingPhaseDownswing) | OFF | |
| > (CA1) COND, Trade swing phase undefined (IN_enmCa1TradeSwingPhaseUndefined) | OFF |
Confirm the inputs by pressing OK, and finally, start the test run with Start.
Chart example and SET file download
The underlying algorithm is highly optimized for execution speed. Generally, it only takes a few minutes until the entire test period is simulated. At the end, you will see a chart similar to the following.
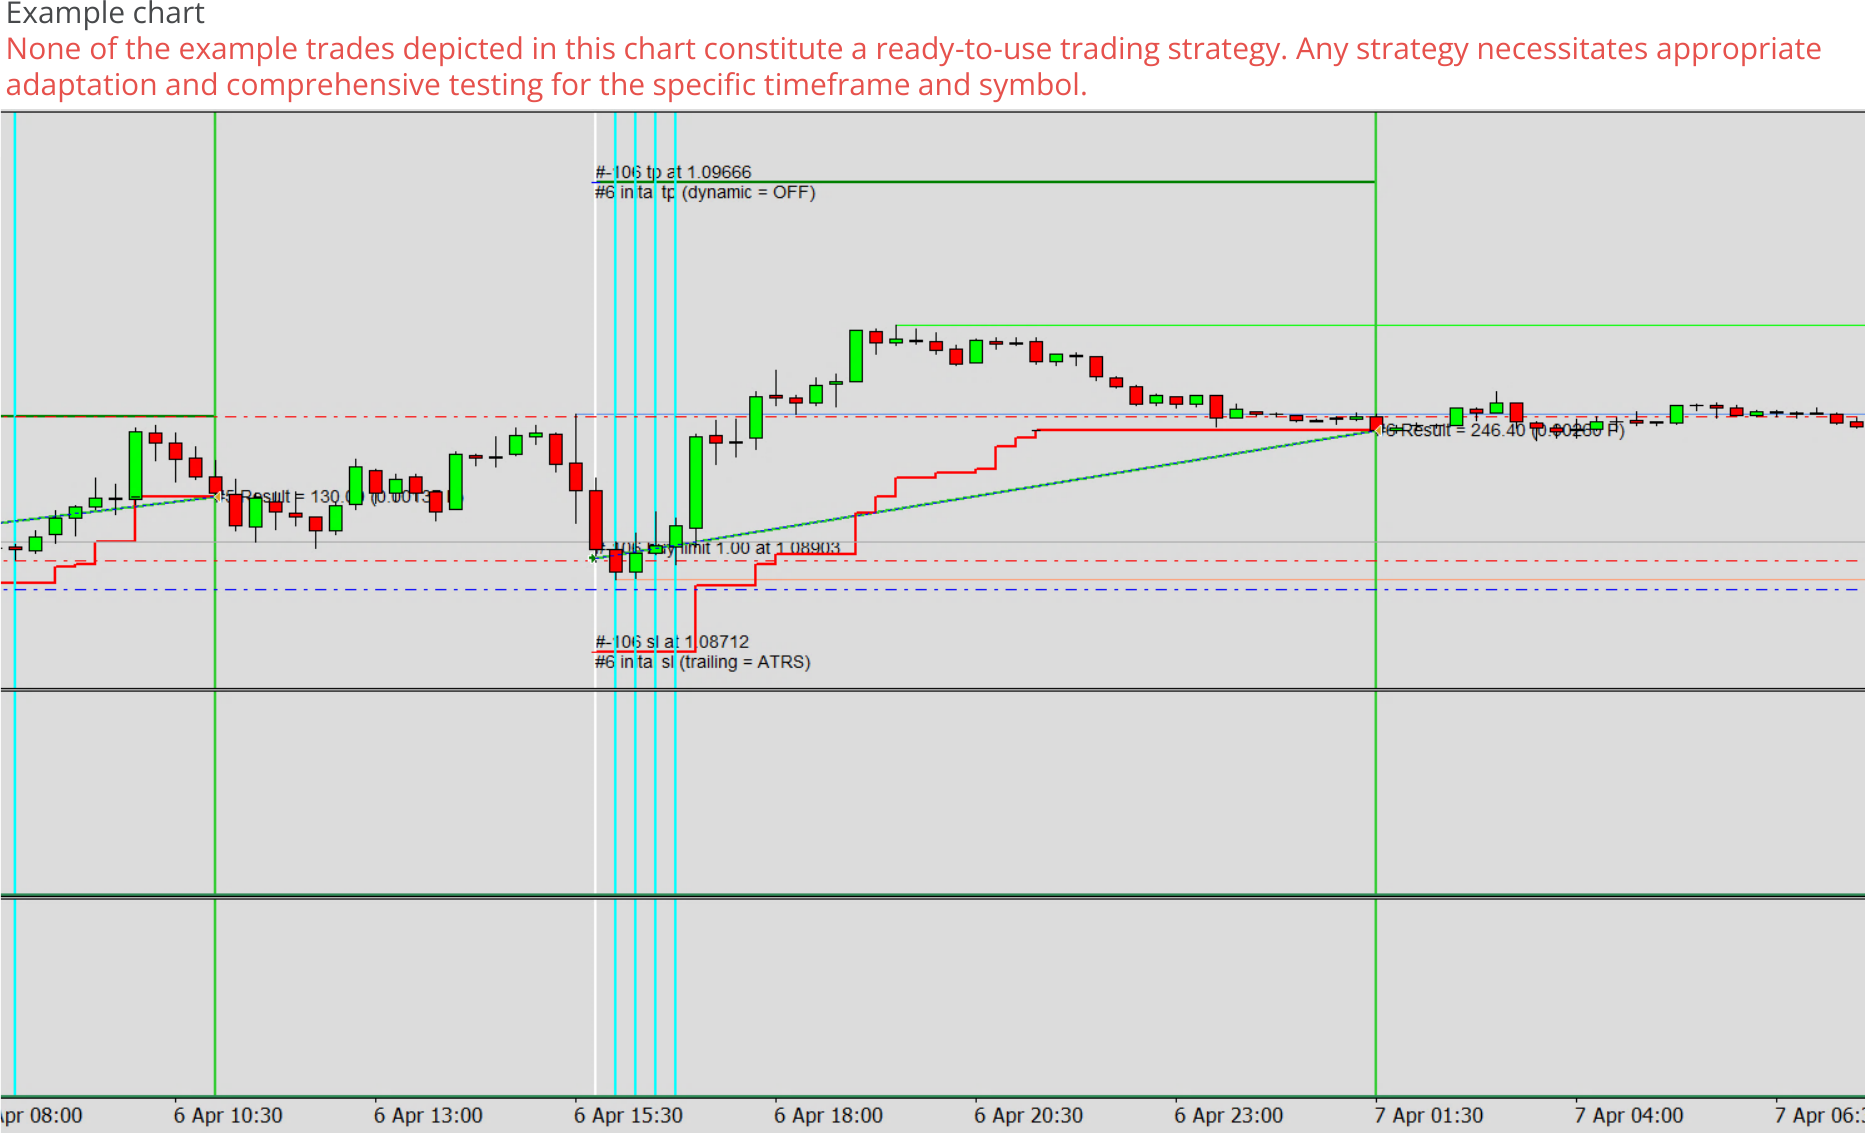
To reproduce the chart from this example, you can download and use the SET file package eab_example_42_v_2_0.set.