No.35: Indicators - Bollinger bands example
Description
You can find an example for the Expert Advisor Builder on this page. If you need to familiarize yourself with the MetaTrader strategy tester and the Expert Advisor Builder, please begin with the Getting Started article.
This example demonstrates the process of signal generation using indicators. Indicators are frequently used tools that simplify a price chart, making the information more accessible for human interpretation or automated processing. These indicators can be used collectively or interpreted individually.
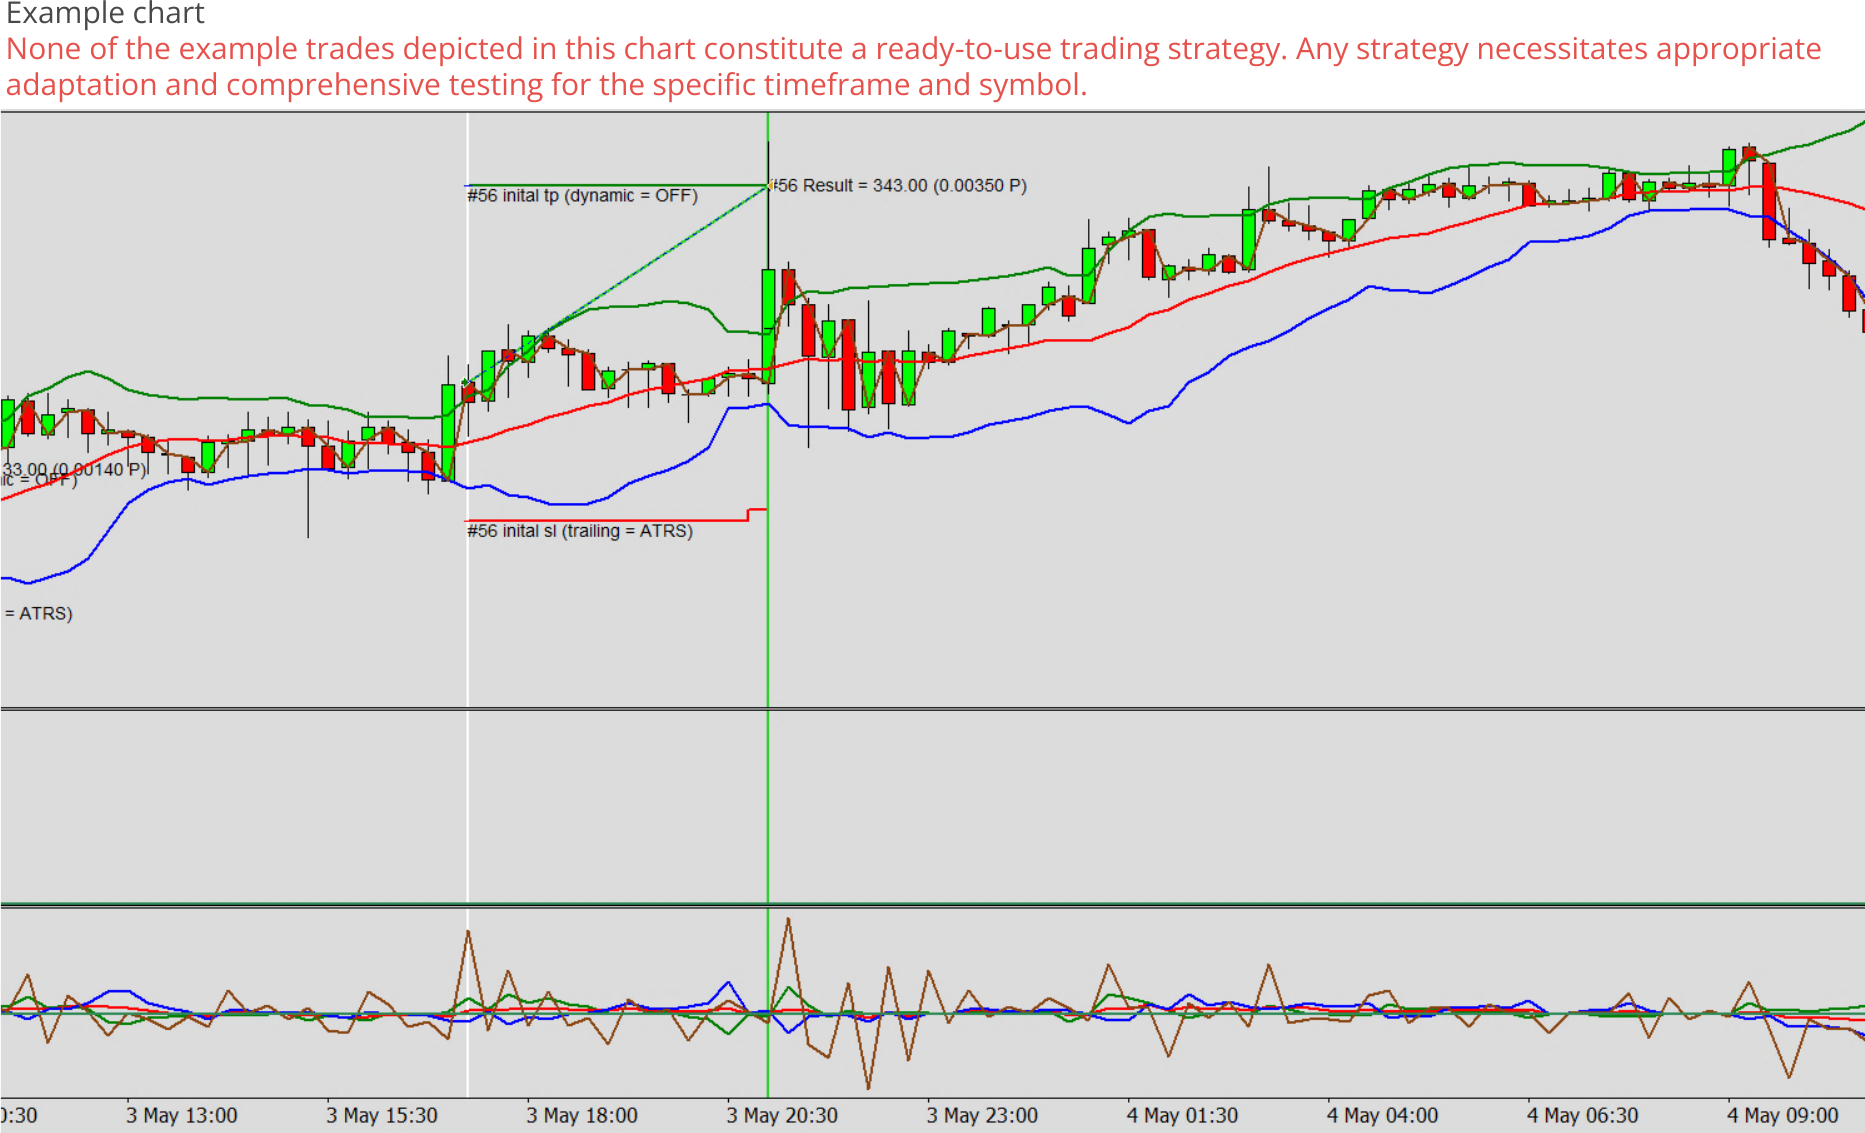
Each trading module generated by the Expert Advisor Builder can evaluate four indicators and four oscillator lines simultaneously, allowing for a maximum of eight indicators in total. Given that using too many indicators is generally not recommended, this number is undoubtedly sufficient. For instance, a complete Bollinger Bands-based trading system, complemented by an open price series indicator, only requires four indicator lines. As shown in the example chat below, this forms the well-known and appreciated Bollinger Band characteristic.
Every trade in this example has an average true range stop loss trailing and a risk ratio-based (1.4) take profit. As is common with many examples for the Expert Advisor Builder, only one trade is allowed to be open at a time, which implies that some signals may be overlooked.
Please note that this is not a plug-and-play trading strategy. A trading strategy needs suitable adjustments, fine-tuning to the timeframe and symbol, and thorough backward and forward testing. Therefore, providing fully working trading strategies as read-to-use examples is impossible. However, this example could serve as a foundation for your trading strategy.
Reset of inputs
Locate the Expert Advisor Builder application in the dropdown menu of the strategy tester settings under FEA Trading\MT4\Expert Advisor Builder 2.0 if you're using a MetaTrader 4 instance or FEA Trading\MT5\Expert Advisor Builder 2.0 if you're using a MetaTrader 5 instance. You can replicate the entire example in minutes by following the steps outlined in this article. To begin, kindly reset the strategy tester input as indicated.
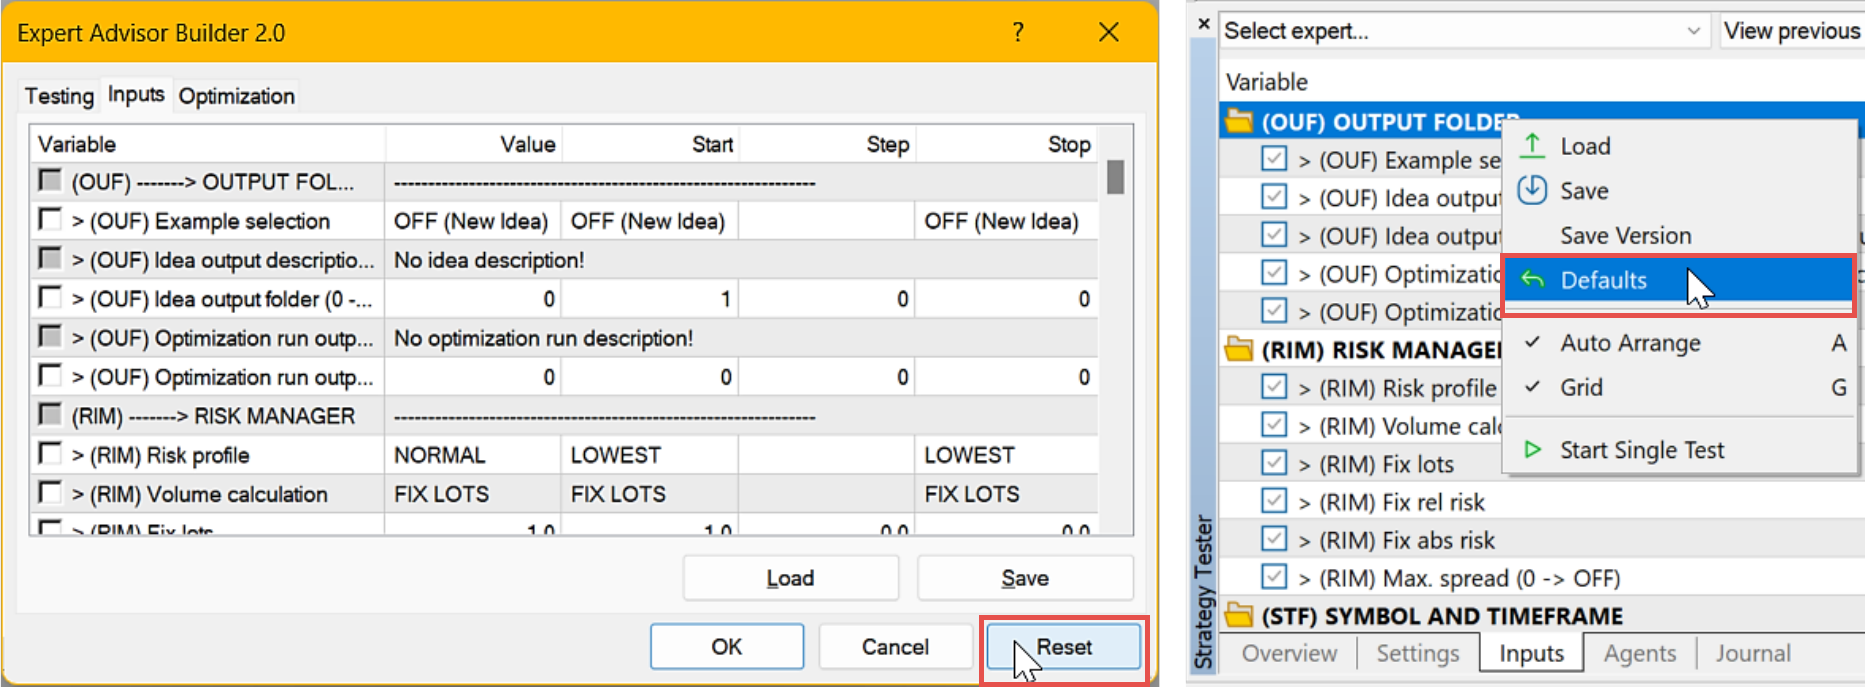
The default input parameters of the Expert Advisor Builder are designed to be highly functional. This implies that only some parameters must be adjusted when creating a new strategy. As a result, even with minimal reconfiguration, the output strategy can be significantly different.
Inputs configuration
Most examples can be executed in any timeframe and on any symbol. However, please set EURUSD as the symbol to be tested, M15 as the timeframe, select Open prices only (MT4) or 1 minute OHLC (MT5) as the model, and the previous four weeks as the test period. Finally, enable the visual testing mode.
Refer to the table below to set up the input parameters for the Expert Advisor Builder.
| Input variable within MetaTrader (Identifier in SET file) | Example value | User manual chapters |
|---|---|---|
| > (OUF) Idea output description (max 63 characters) (IN_strOufIdeaOutputDescription) | No.35: Indicators - Bollinger bands example | Output Folder |
| > (INA1) CONF, Signal in use (IN_enmIna1SignalInUse) | ON | Configuration Available Indicators and Default Values Example |
| > (INA1) CONF, Selection (IN_enmIna1Selection) | BB - Bollinger Bands | |
| > (INA1) CONF, Line index (IN_nIna1LineIndex) | 1 | |
| > (INA2) CONF, Signal in use (IN_enmIna2SignalInUse) | ON | |
| > (INA2) CONF, Selection (IN_enmIna2Selection) | SMA - Simple Moving Average | |
| > (INB) CONF, Signal in use (IN_enmInbSignalInUse) | ON | |
| > (INB) COND, Relation 1 INB1 to INB2 (IN_enmInbRelation1) | VALUE 1 CROSS VALUE 2 | |
| > (INB1) CONF, Signal in use (IN_enmInb1SignalInUse) | ON | |
| > (INB1) CONF, Selection (IN_enmInb1Selection) | BB - Bollinger Bands | |
| > (INB1) CONF, Line index (IN_nInb1LineIndex) | 2 | |
| > (INB2) CONF, Signal in use (IN_enmInb2SignalInUse) | ON | |
| > (INB2) CONF, Selection (IN_enmInb2Selection) | PRICE - Price directly from series |
Confirm the inputs by pressing OK, and finally, start the test run with Start.
Chart example and SET file download
The underlying algorithm is highly optimized for execution speed. Generally, it only takes a few minutes until the entire test period is simulated. At the end, you will see a chart similar to the following.
To reproduce the chart from this example, you can download and use the SET file package eab_example_35_v_2_0.set.